
Part 2
In parts 1 and 2 we touched on 2016's winners and losers, equity valuations, the present risk in bonds and an economic backdrop that strongly suggests that a recession is not something we should be presently losing sleep over. So, in terms of prevailing market conditions, we've already seen a picture that inspires optimism over the prospects for economic growth and, thus, corporate earnings growth going forward. Okay, so what else?
Well, there's what we call the technical setup. The challenge with the technicals is that they encompass more indicators than you can possibly shake the proverbial stick at (I'll continue to mix it up in the video charting commentaries). That said, there are some that fit our mode of operation quite nicely, and, therefore, that we tend to focus on more than others. Essentially, we're after the longer-term trends in markets, which allows us to narrow our focus to what we consider to be the best long-term trend indicators.
At the very top of our list is what's called the 200 day moving average (dma). It's a deceptively simple indicator: a security's average closing price of the last 200 trading days. It essentially quiets the noise and illuminates the longer-term trend, or strength, of the security, commodity or index in question. I like it because, as you'll see in the following, it lives up to its reputation as one of the best gauges of trend.
We plot the 200-dma on a line chart and look for two things: the shape, or direction, of the trend and where the security, commodity or index trades in relationship. A decisively positive slope tells us we're experiencing a strong/healthy uptrend. A downward slope indicates the opposite. When the price of the item charted trades above its positive-sloping 200-dma the uptrend is confirmed. The price crossing below is a signal that the uptrend may be ready to reverse, although confirmation only comes when the 200-dma line has clearly changed direction. A cross above signals the potential reversal of a downtrend. When the price dips below, or touches, the line and quickly rebounds during an uptrend it's considered a confirmatory test and is bought heavily by techinically-minded traders. A failed break above the line during a decline confirms the downtrend and inspires heavy selling.
So let's check it out. Here's a look at the 20-year daily chart of the S&P 500 Index. The top panel includes the index value (white) and its 200-dma (blue). I also placed the 200-dma by itself in a second panel -- as it's easier to follow the shape without the price jumping around and through it. I placed yellow arrows in panel 1 at every instance where the price bumped against or dipped below the 200-dma. These would be areas of warning that the trend is at risk of reversing. The red arrows point to areas where our indicator signaled the end of an uptrend. The red curves highlight failed upside breaks that would've been profitable selling opportunities for the technician. The green curves highlight the failed downside breaks that turned out to be profitable areas of entry. The green arrows show a clear upward reversal in trend: click charts to enlarge...

While we can venture deep into the weeds and layer on shorter-term indicators that might have added confidence to whether the bumps and breaks were to be buying or selling opportunities (we'll leave those for the traders, and, for illustration sake only, my future videos), suffice it to say that this highly respected long-term trend indicator -- with its positive slope and its current price trading on top -- signals that the present uptrend in the U.S. equity market remains intact.
Now we'll run the same analysis through the major sectors (using index exchange traded funds [ETFs]). I'll leave off all the arrows and curves and allow you to simply eyeball the trends for yourselves.
Technology:
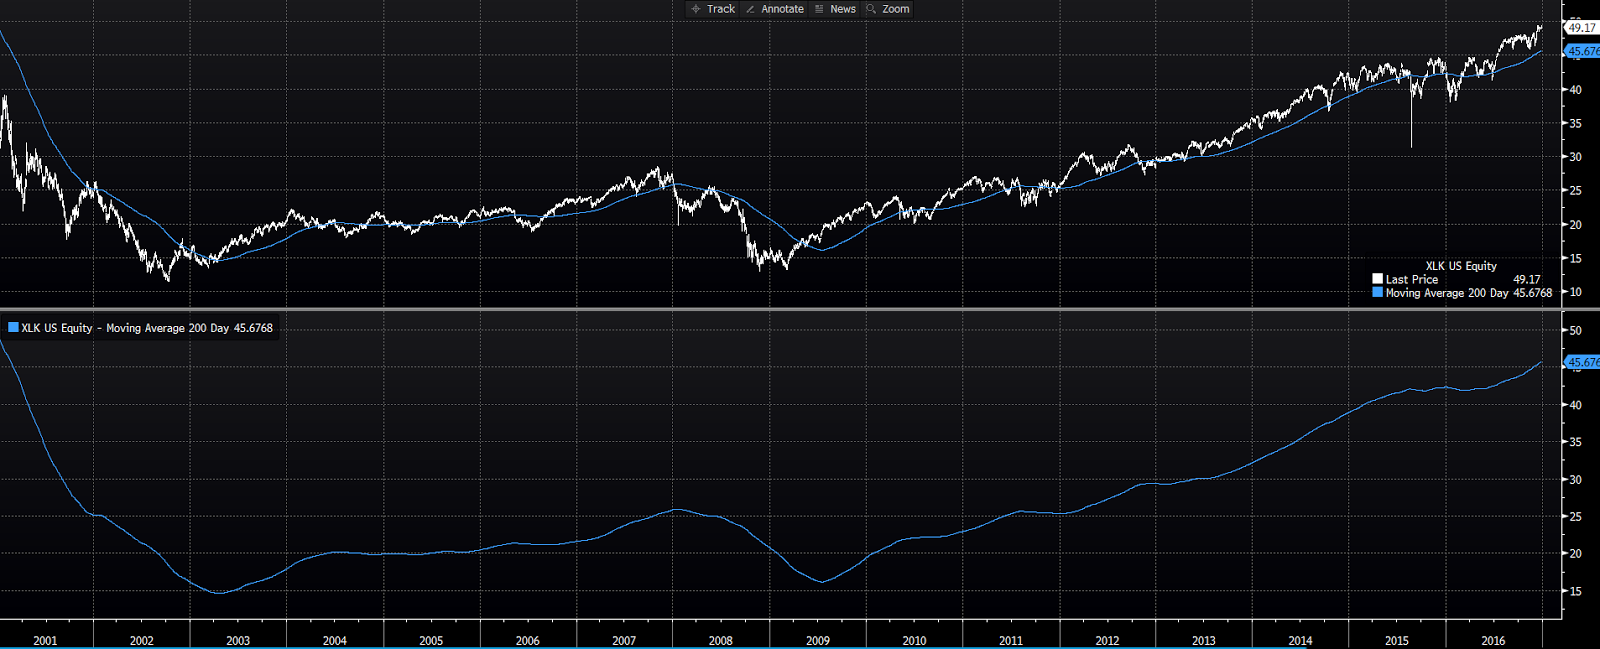
The 200-dma slope and the position of the price confirm the present uptrend.
Industrials:

The 200-dma slope and the position of the price confirm the present uptrend.
Materials:

The 200-dma slope and the position of the price confirm that an uptrend began in early 2016.
Financials:

After a long stretch of poor relative performance financials have broken strongly to the upside, with the 200-dma sending a positive signal going forward.
Energy:

After peaking in late-summer 2014 and suffering a steep prolonged decline (with 200-dma confirmation a few months in), the energy sector bottomed in early 2016 and has staged an impressive comeback. Presently trading above its upward-sloping 200-dma.
Consumer Cyclicals:

The 200-dma slope and the position of the price confirm the present uptrend.
Telecom Services:

The 200-dma slope and the position of the price confirm the present uptrend.
Consumer Staples:

A flattening 200-dma and price trading below the line is a signal that the long upward trend in consumer staples stocks is suspect.
Health Care:

Still in a downtrend that began early 2016 (confirmed by the downward move in the 200-dma), the health care sector looks to be building a base that could lead to a move back above its 200-dma. The slight upward slope of the dma line is signalling that possibility within the not-too-distant future.
Utilities:

Utilities peaked mid-year and, like health care, may have entered a short-term consolidation pattern. The 200-dma has yet to signal the start of a longer-term downtrend. Utilities may have a difficult time finding their way back to a sustainable uptrend against the potential headwinds of an accelerating economy and higher interest rates.
To sum it all up, clearly, the U.S. sector charts -- with cyclicals improving and defensives struggling -- are sending a signal that confirms the positive implications of the economic data we reviewed in Part 2. Which, at this juncture, supports the logic behind our present sector targets within client portfolios. And, as the following chart of TLT (tracks long-term treasury bonds) illustrates (trading below a downward-sloping 200-dma line), supports our notion that it's too soon to go venturing back to the bond market:

Now let's run foreign equity markets through our analysis.
Foreign Developed Markets:

After a prolonged run of under-performance, relative to the U.S. market, foreign developed markets (via the MSCI Europe, Australia and Far East index) are showing signs that a reversal in trend may be in the offing. As mentioned in Part 1, and illustrated below, relative valuation looks compelling.
The Euro Zone (Euro Stoxx 50 Index):

Ditto the developed markets index (EAFE).
Japan (MSCI Japan Index):

Ditto EAFE and the Euro Zone.
Emerging Markets:

The EEM's (tracks the MSCI Emerging Markets Index) 200-dma suggests that this year's rally could be the beginning of a longer-term trend. However, the post-U.S. election swoon has the price currently testing the trend line. This'll no doubt be the stuff of upcoming commentaries.
Here's a look at the price to earnings ratios (valuations) of the countries/regions we track. Recall from Part 1 that the U.S. sector valuation spreadsheet had some red in it:

There clearly exists some compelling value outside the U.S..
Believe me, we can do this all day. The angles from which to assess market conditions are virtually never-ending. As in most things, however, keeping it simple is absolutely key if we're to filter the noise and keep our heads about us. That said, I will continue to offer up other data/indicators in my weekly videos that I find to be pertinent and, for you, palatable.
Speaking of keeping our heads about us, of all the information I'm offering up in this year's year-end message, the following is by far the most useful and pertinent to the objective of achieving long-term investment success.
While the above review and assessment of one of the better long-term trend indicators may make this stuff look easy, I think it only fitting that we finish up with a look at short-term market reality.
First, we isolate 2013; the last super good year we had in the equity market. Here's the S&P 500's 200-day moving average start to finish in 2013:

Easy peasy all the way! Right? Well, while the 200-dma offered absolutely zero worry about the long-term trend that moved right through 2013, hanging in and actually capturing the gain required a supreme act of courage on the part of the individual investor who, alas, actually looks at, and thinks about, his/her stuff everyday -- the ever-suffering investor he/she be.
Courtesy of Chris Ciovacco, here's a look at all of the draw-downs the emotionally-sensitive investor had to endure to catch all of 2013's fabulous 29.6% gain:

Oh my! Thirteen events in one year where the S&P 500 plunged anywhere from 1% to 7.5%, for a sum total of 37.6% worth of draw-downs. Richard Driehaus's quote (his reference to individual investors) on top of the chart speaks to the single biggest reason the individual investor, left to his/her own devices, tends to struggle so mightily in the market.
The Driehaus quote is so relevant I just have to repeat it:
They tend to confuse short-term volatility with long-term risk. The longer the time period, the lower the risk of holding equities. People focus too much on the short term, week-to-week and month-to-month price changes, and don't pay enough attention to the long-term potential.Our objective here at Private Wealth Advisors is to do our very best to take full advantage of the financial markets' long-term potential, while communicating to our clients in a manner that helps them keep the inevitable events and circumstances that impact the markets in their proper perspective (i.e., to help them to not become the stereotypical subjects of the above quote). In other words, here's our Purpose Statement:
OUR PURPOSE
Whether it’s the amazing speed in which technology has advanced over recent years, or, in a competitive environment, the need for firms to market their consequently less unique process(es), we have seen what we view to be an industry-wide packaging of investment and financial services; a commoditization, if you will.
At Private Wealth Advisors — while we do employ state of the art technology that allows us to study and assess economies and asset classes the world over, and assists us in analyzing portfolios, objectives and strategies — each and every client is a study in and of themselves. They bring to our table their needs, concerns, ambitions and fears, and they lever our experience and expertise in what becomes a long-term commitment to addressing, accounting for, and ultimately satisfying their financial objectives.
Frankly, it’s about emotion. Life’s decisions, be they financial or otherwise, are rooted in emotion. We measure our success, not in numbers, but in our ability to make our clients’ lives better at the deepest personal level.
The above is not some catchy commercial meant to entice new clients to our firm. It simply states what — over the past three-plus decades of catering to the financial needs of individuals, families and their institutions — we've come to know to be our purpose:
If our clients live their lives in comfort, if they go about their days without a financial worry, without reacting to or fretting over the inherent volatility of financial markets — if our commitment to them instills, or enhances, that sense of wellbeing — we are indeed successful as a firm.
Thank you for reading!
All of us here at PWA wish you and yours a Healthy and Happy New Year!
Marty
No comments:
Post a Comment