
Okay, with that off my chest, what about January? It definitely has been an awful month the past three years. In fact, this year's brought us the worst 2-week start to a year in the history of the market.
Here they are: click charts to enlarge...
2014
2015
2016

So let's forget about all that long-term stuff I always preach, sell everything now and buy back on February 1st! I mean, the last few years offer strong odds that January is going to stink!
Well, okay, but before we do, shouldn't we at least consider the setups going into the past three Januarys? Yes? Good! We'll mess around with the moving average concept we've explored in several of the videos, and in Part 3 of this year's year-end letter. Now, the 200-day moving average, that I featured in Part 3, will be of no help in this short-term analysis. To really get the near-term character of the market we have to shorten up the indicators and employ several.
Now think in terms of momentum. We'll be looking at the 10, 20, 30, 40 and 50-day moving averages. When the market is in the midst of a strong uptrend it's got momentum under it, and the moving averages fall in perfect chronological order. When a trend is losing steam the averages get all mixed up. And, when it's really going south, they stack up in reverse. Which was precisely the case on 12/30 of last year, heading into the worst start ever:

Yep, the moving averages indicator was flashing a huge sell signal (to short-term traders) on 12/30/2015.
So let's cut to the chase and look at where we are today:

Now that, with the moving averages all falling in line, is the definition of a bullish setup! Suggesting that this coming January stands a chance of breaking the recent mold. So, no! Even if I were of the mind (or, lost it, perhaps) to think that we can profitably time the market, the current setup says to stay the course. Although, I have to say that the 10-day is rolling over -- you've noticed the market losing momentum lately.
But what about 2013 and 2014? Shouldn't we look at those setups as well? Absolutely!
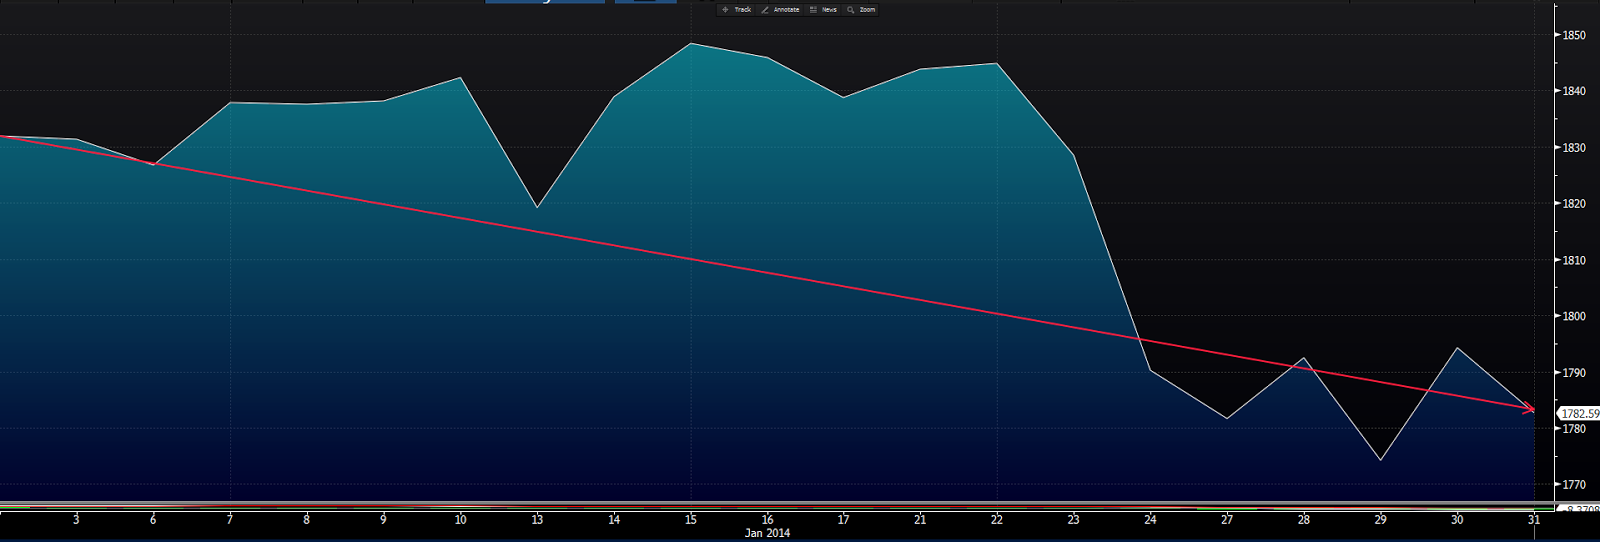
Here's 2014:

Definitely not as ugly as last year. But the moving averages were a little out of order, and by the end of the month, right before things got ugly, the bearish look was fully in place.
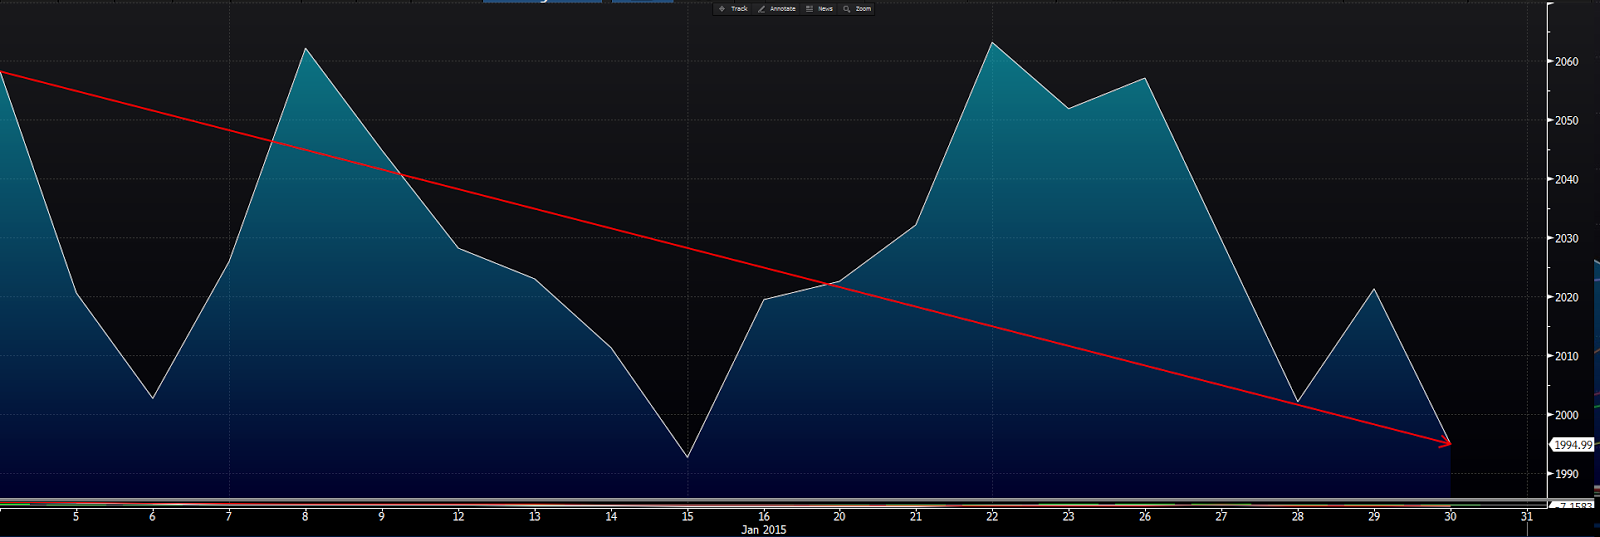
Here's 2013:

Actually, this time in 2013, the setup was quite bullish. And, indeed, the market hung in there just fine until roughly the last week of the month; when the trend fell apart, and the moving averages quickly followed suit.
So you can definitely see the short-term nature of the signals sent by the shorter-term moving averages.
Let's look at one more: 2013 was a fabulous year for folks who held stocks start to finish. Here's the setup going into January:

Well, not perfect, with the 50-dma above the 40. But by the time January came to a close, that classic short-term bullish sign was in full force.
And a crazy-good year ensued:

Back to the beginning: What if the setup right now was just like last year's. I mean, what if we were staring down an indicator that told us a year ago that we were on the cusp of the worst start in history? Would you sell? And if you did, and the market tanked, would you have the courage to buy back amid the absolute doom and gloom the media outlets I threw under the bus in paragraph one would absolutely be selling, like they did in January of this year? I dunno.... You'll have to tell me...
Sure, you might think that I just imparted to you a tremendous short-term trading indicator. And you might want to fire me (assuming you're a client) and go it your own with a charting program defaulted to those moving averages. And let's pretend you went that route back at the earliest point of the above analysis (November 2012). Here's how your chart would look today:

Well, I wish you luck! I'm afraid you'll need it...
For those of you who didn't just exit the page to go prepare your dear John to Marty letter, take a look at the same chart with that plain old 200-day moving average (bold blue line) we looked at in part 3 folded in:

That's what I'm talking about! The long-term trend line essentially said sit back and enjoy the long-term trend -- save, that is, for the periodic rebalancing to your comfortable stock/fixed income allocation, and, for our clients, a little sector/regional rotation along the way.
Now, look at that last chart again. Notice how the moving averages were lined up at those points where the price hit, or threatened to hit, the 200-dma and bounced right off (in retrospect, great buying points). Yep, that yellow line that sits at, or is heading toward, the top in each instance is the 50-day. And the purple line at the bottom is the 10-day. Those were bearish signals that remained right up to when the market bounced hard to the upside. Dang! I sure hope you didn't exit the page a minute ago!
I'll leave you with Jesse Livermore; history's most celebrated stock trader. His story, as depicted in Edwin Lefevre's 1923 classic Reminiscences of a Stock Operator (one of the best books I read in 2016), imparts lessons that many of today's best traders/investors say shaped their views of the markets. Take the following to heart if/when the volatility in 2017 has your heart palpitating:
“After spending many years in Wall Street and after making and losing millions of dollars I want to tell you this: It never was my thinking that made the big money for me. It always was my sitting. Got that? My sitting tight!”Have a great weekend! And Happy New Year to you yours!
Marty
Hello everyone!
ReplyDeleteThis is really nice post
Thank you for protecting the natural environment and contributing to waste diversion success in Halton Region! Share...See this post takes every feedback from its customers and tries to implement it to improve their customer service
Click here :Avira Total Security Suite For PC Windows(Free Download Windows Software)