
Sticking with the sentiment theme, here's from Monday's morning note:
"As we've been flagging lately, our sentiment indicator is beginning to notice a crowd forming over on the bull side of the proverbial boat (investors sneaking over from the bear side)."
I went on to feature 2 (AAII sentiment and the equity put/call ratio) of the 8 inputs to our own "Fear/Greed Index" -- which presently scores firmly in net greed territory, at -37.5 (oscillates between +100 [max fear] to -100 [max greed]) -- which is now piercing levels that too-often coincide with market tops (be they short or long-term).
Well, we just received Investor Intelligence's weekly read on advisor sentiment, and it has worked its way right to the edge of the danger zone as well... Here's from the report:
"The bulls moved up to 53.4% from 51.3% a week ago. For the second week we note the most bulls since Nov-2021 when they reached a danger level of 57.2%. That level suggests many professionals have shifted their funds to equities, limiting the amount to drive markets still higher. Overall, the bull count becomes a concern when it exceeds 55%."
"The latest market advance cut the bears to 20.6%, from 21.6% last issue. That is the fewest bears since early Jan 2022..."
"There was further expansion of the bull-bear spread to +32.8%, compared with +29.7% a week ago, and 24.6% before that. . That is the largest positive difference since Nov-2021 when it was falling from even higher levels that summer. A spread above +30% is the first sign of elevated risk."
To illustrate why sentiment is something to watch, I red-circled the two reference points mentioned in the above snippets in the following SP500 graph:
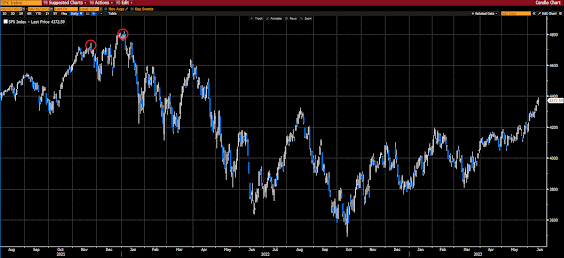
"...here, top panel, is our chart of the American Association of Individual Investors’ widely-followed sentiment survey... Green line represents bullish sentiment, red line bearish... I red-circled the times when the spread went positive (more bulls than bears), and yellow-circled when it came too close (contrarianly-speaking) for comfort... In the bottom panel I circled those same points on the SP500 graph and drew an arrow in the direction shortly thereafter:
2/3rds of the time a decline shortly followed... Note that the present signal is far and away the "strongest" of the current bear market!"

Stay tuned...
Europe is mostly red so far this morning, with 13 of the 19 bourses we follow trading down as I type.
US equity averages are mixed to start the session: Dow up 73 points (0.20%), SP500 up 0.10%, SP500 Equal Weight up 0.01%, Nasdaq 100 down 0.01%, Nasdaq Comp down 0.01%, Russell 2000 down 0.30%.
As for Friday's session, US equity averages were mixed: Dow down 0.7%, SP500 up 0.1%, SP500 Equal Weight down 0.2%, Nasdaq 100 up 0.7%, Nasdaq Comp up 0.4%, Russell 2000 down 1.2%.
This morning the VIX sits at 14.02, up 1.01%.
Oil futures are up 1.55%, gold's up 0.46%, silver's down 0.81%, copper futures are up 0.46% and the ag complex (DBA) is up 0.98%.
The 10-year treasury is up (yield down) and the dollar is down 0.37%.
Among our 34 core positions (excluding options hedges, cash and money market funds), 22 -- led by TLT (long-term treasuries), XLE (energy stocks), OIH (oil services companies), XLV (healthcare stocks) and XLP (staples stocks) -- are in the green so far this morning... The losers are being led lower by MP Materials, SLV (silver), VNM (Vietnam equities), VPL (Asia-Pac equities) and PHO (water infrastructure stocks).
Words to heed! (emphasis mine)
"You have to look at real fundamentals, not at what policy makers want to happen. The willing disbelief of people can carry on for a long time, but eventually it is overwhelmed by the market."--Colm O'shea
Timely!!
Have a great day!
Marty
No comments:
Post a Comment