Staying with the topic of US stocks for the moment: We can assume, with confidence, that the durability of the current bull market is largely due to the overwhelming consensus among investors that an economic "soft landing," and, with it, ever-rising corporate profits is essentially at hand.
A soft landing for stocks would presumably mean continued higher prices amid declining bond yields -- the proverbial best of both worlds, or, let's say, the ideal Goldilocks scenario.
While that's a narrative that enjoys popular support, if we’re talking empirical support, well.... not so much.
You see, recessions and bear markets, with historically-rare exception, typically follow Fed tightening cycles... However, as the weeks turned into months during the course of 2023, with -- per the overwhelming consensus among economists and analysts (us included) -- its high odds of recession, then months into years, as 2024 as well comes to a close amid continued expansion, ultimately the "soft landing" story is looking to be more truth than phantasy this time around.
But, then again, given recent trends/developments, while indeed the stock market may have a bit more oomph left in it, suffice to say that the odds of it occurring amid declining interest rates are, well... declining.
As you'll see below, our own assessment of general conditions -- while still not rosy -- has improved notably over the past few months... Which, in essence, means the odds of seriously lower interest rates are somewhat lower than they were, say, three months ago... Which, for example, is expressed in market-based expectations of what the Fed will do going forward.
Back in early September, fed funds futures were pricing in a 2.8% fed funds rate by December of next year, down a bunch from 5.50% at the time:


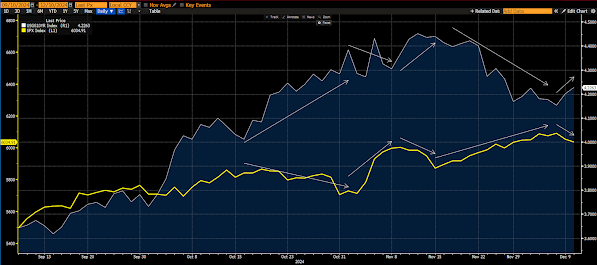
Ironic, to some, how the Fed has cut by 0.75% since September, and bond yields have, for the most part, gone in the opposite direction.

Note how stocks (SP500, yellow line) wavered, but certainly didn't break, as rates rose, and then caught some wind as rates came down a bit off of their November 15 highs:
"The labor market is in the midst of an unusual limbo in which job creation (hiring) and destruction (layoffs) are both muted. We expect that continued softening will eventually provoke a wave of layoffs, triggering a vicious circle in which shrinking payrolls beget slower spending, begetting further payroll contraction and still slower spending growth until businesses slash discretionary investment and a recession ensues.
While we expect the recession will be mild and brief, we nonetheless expect the S&P 500 will suffer a bear market.
Our killjoy outlook merits defensive portfolio measures, but we recognize that views and strategies can and should periodically diverge. Fundamentals may win in the end, but investors can experience grievous injury waiting for their views to be validated."
"If the data invalidate our view, we’ll turn more constructive, and our asset allocation recommendations will likely adjust to reflect it."
Underweight equities in multi-asset portfolios over tactical (zero-to-six-month) and cyclical (six-to-twelve-month) timeframes. In line with our stop, we can envision a scenario in which stocks rally through the end of the year and into January. We nonetheless expect an equity bear market will unfold sometime in the first half and will be looking for an opportune entry point to position against equities if our stop is triggered. We will be eager to narrow the underweight soon after the 20% bear-market threshold is reached and will likely look to overweight equities around -30% to -35%, if they fall that much.
Overweight fixed income over tactical and cyclical timeframes. We expect a recession will bring lower rates across the Treasury curve while spreads widen. Investors should overweight Treasuries while underweighting investment-grade and high-yield corporate bonds.
Overweight cash. Cash’s optionality is welcome near inflection points like the one we believe is approaching and its opportunity cost versus bonds is very low while the yield curve is as flat as it is now.
And here's from MRB Partner's team, who, contrary to BCA, sees continued expansion in 2025, but that -- consistent with our commentary above -- doesn't, in their view, translate to an ideal setup for the equity market.
MRB's opposite stance (bearish) on fixed income vs BCA's (bullish) better reflects their opposing views on the 2025 economy:
(emphasis mine)
"MRB Asset Allocation Strategy: “Ongoing Economic Expansion, But Lower Returns And Greater Volatility” updated our multi-asset portfolio as we look out to the investment environment in 2025.
The economic backdrop will be supportive of risk assets, but considerably lower returns on global equities loom and, by extension, balanced portfolios after this year’s strong gains.
A moderate pro-growth portfolio tilt is appropriate for now, but there is the potential for sizable portfolio changes as the year progresses.
Greater market volatility will be driven by both heightened policy uncertainty as the next Trump Administration settles in (although we assume he will not jeopardize U.S. or global economic growth), and yet another upleg in global bond yields due to sticky DM inflation.
U.S. 10-year yields will at least re-test the 5% level, and thus we remain underweight bonds in a multi-asset portfolio, and overweight inflation protection and credit within a fixed-income portfolio. However, credit will generate much lower returns given the starting point of historically tight spreads over government debt.
Rising corporate earnings should sustain the equity uptrend in the near run, but gains will be much more muted and volatile than in 2024. Risks will rise as bond yields eventually re-test 2023 highs.
The risk-reward should eventually shift in favor of select non-U.S. equity markets, including emerging markets, Japan and the euro area.
As you'll see when we outline our longer-term thesis in the coming days, we very much concur with MRB's "eventual shift" view expressed in that last sentence.

The above graph takes our index back to inception (June 2017).


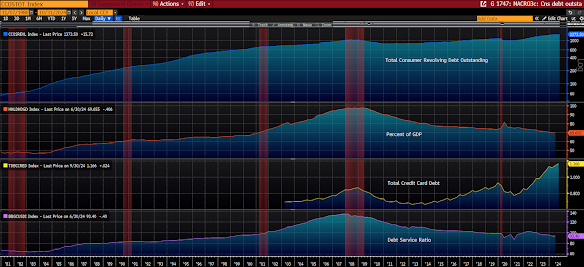
US Consumer Debt Outstanding

US Mortgage Purchase Applications

US Housing Starts

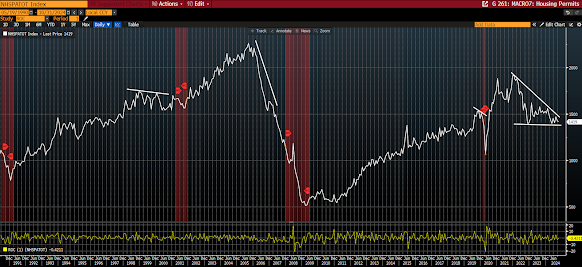
US Housing Permits
US Consumer Confidence

US Housing Index (Homebuilder Confidence)

US Jobless Claims


US Job Openings and Quits Rate

KC Fed US Labor Market Conditions Index

ISM US Manufacturing Index

ISM US Services Index

US Small Business Optimism

US Industrial Production

US Capacity Utilization

US Durable Goods Orders

US Capital Investment (capex)

US Commercial and Industrial Loans

US Heavy Truck Sales

US Truck Tonnage

CASS Freight Index

Caterpillar Global Sales

Global PMI

US Leading Economic Indicator/Coincident Economic Indicator Ratio

Chicago Fed National Activity Index

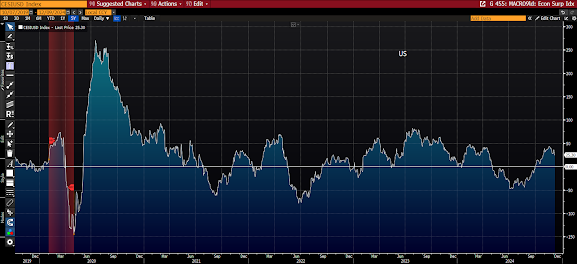
US Economic Surprise Index

US Inflation (PPI)

US Inflation (CPI Swaps)

US Inflation (Employment Cost Index)

Bloomberg Commodity Index

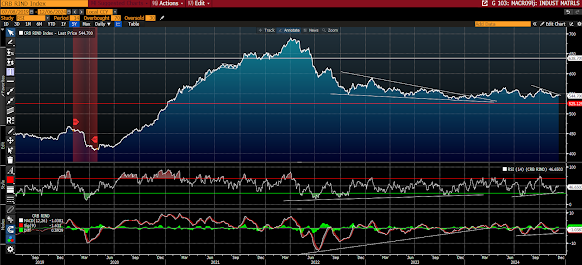
CRB Raw Materials Index
Copper Price

Baltic Dry Index


SP500/Long-Term Treasury Ratio

US Staples/Discretionary Ratio

US Treasury Yield Curve

Per our own assessment of current general conditions, as well as the featured competing views of two of the world's top research firms, suffice to say that the go-forward setup presents a resoundingly mixed picture for US equities... Leaving us therefore inspired to remain very diversified across asset classes, and across the globe, while staying plenty liquid, and to continue hedging our US equity exposure with options.
In parts 3+ of this year's message we'll explore the longer-term global investment setup as we see it unfolding in the years to come.

No comments:
Post a Comment