
As you've noticed, stocks have had a rough go of it these first seven weeks of 2022.
The easy gains of 2021 (largest drawdown during the year was ~5%), are now but a faint memory.
I often find myself, during client review meetings, illustrating how fast risk happens, and how quickly months (sometimes years) worth of gains in the stock market can evaporate during a risk-off stretch.
This year would, for the moment, be a case in point.
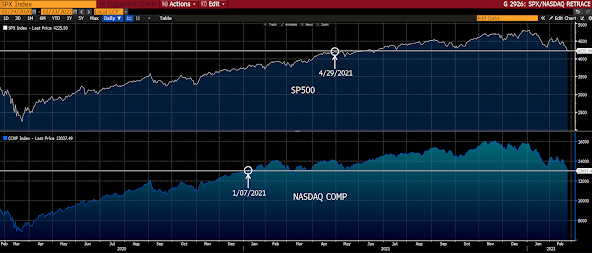
I.e., in a mere seven weeks, nearly 10 months of price gains for the S&P 500 (top panel) have been taken back. For the Nasdaq Comp (bottom panel) we're talking over 13 months:
Operative words above being "for the moment." For we should expect that the buy-every-dip mantra that so prevailed the past several years ain't dying that easily.
I.e., there's definitely some upside potential as markets get short-term "oversold."
Probably the most-used measure of oversold-(and overbought)-ness is the Relative Strength Index (RSI). Which, in the below SP500 case, measures the latest price action relative to the past 14 days. Below 30 represents an oversold state, and often inspires buyers looking for a short-term pop.
We're getting close:
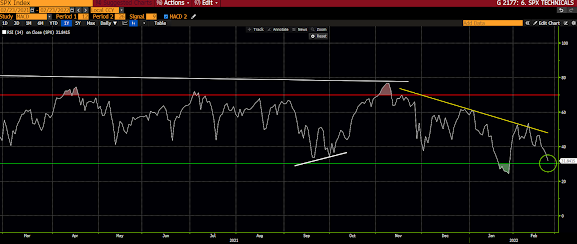
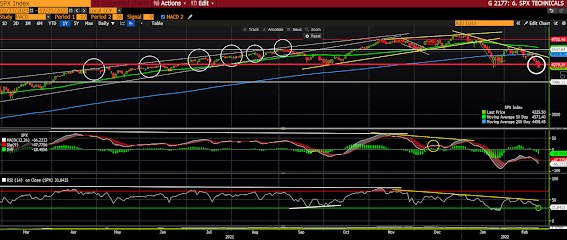
However, when we zoom out -- while short-term pops are highly likely in the offing -- the technical picture right here ain't pretty.
Note the bold white circle at the far right, which shows today's close breaching that support line we highlighted in this morning's note:
I'll pop back in soon with an in-depth video update of the charts...
No comments:
Post a Comment