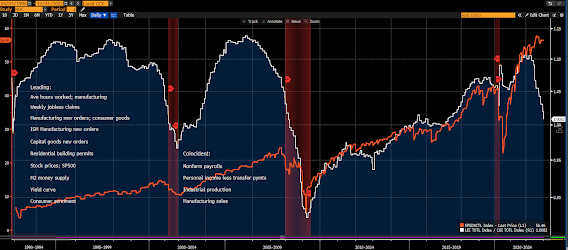
So, if there's one graph (other than the one for our own index) that illustrates what has us not yet believing this year's rally in equities, it's this one (the Leading Economic Indicator/Coincident Economic Indicator Ratio):

Why? Well, other than its relationship to past recessions (red shaded areas), I'll fold in the aggregated corporate earnings for S&P 500 members:

And while I'm at it, might as well include the S&P 500 itself:

Yep.... the risk/reward setup right here remains uninspiring.
Asian stocks were mostly lower overnight, with China shuttered this week for the lunar holiday... Japan, however, once again bucked the trend, with a 1.5% gain on the session.
Europe's on its heels so far this morning, with 17 of the 19 bourses we follow trading down as I type.
US stocks are lower to start the session: Dow down 188 points (0.56%), SP500 down 0.70%, SP500 Equal Weight down 0.83%, Nasdaq 100 down 0.68%, Nasdaq Comp down 0.71%, Russell 2000 down 0.72%.
The VIX sits at 20.41, up 3.03%.
Oil futures are down 0.82%, gold's down 0.68%, silver's down 1.00%, copper futures are down 0.90% and the ag complex (DBA) is up 0.46%.
The 10-year treasury is down (yield up) and the dollar is up 0.22%.
Among our 36 core positions (excluding options hedges, cash and short-term bond ETF), only 4 -- AT&T, Brazil equities, ag futures and treasury bonds -- are in the green so far this morning. The losers being led lower by AMD, Dutch Bros, MP Materials, Albemarle and oil services companies.
"...there is a real economy and there is a financial economy, and the two are closely entwined but different."
--Dalio, Ray. Principles for Dealing with the Changing World Order: Why Nations Succeed and Fail
Have a great day!
Marty

Agree! Thanks Marty!
ReplyDelete