
Here's the lead-in to our latest internal equity market conditions update, plus our commentary on the dollar's technical setup:
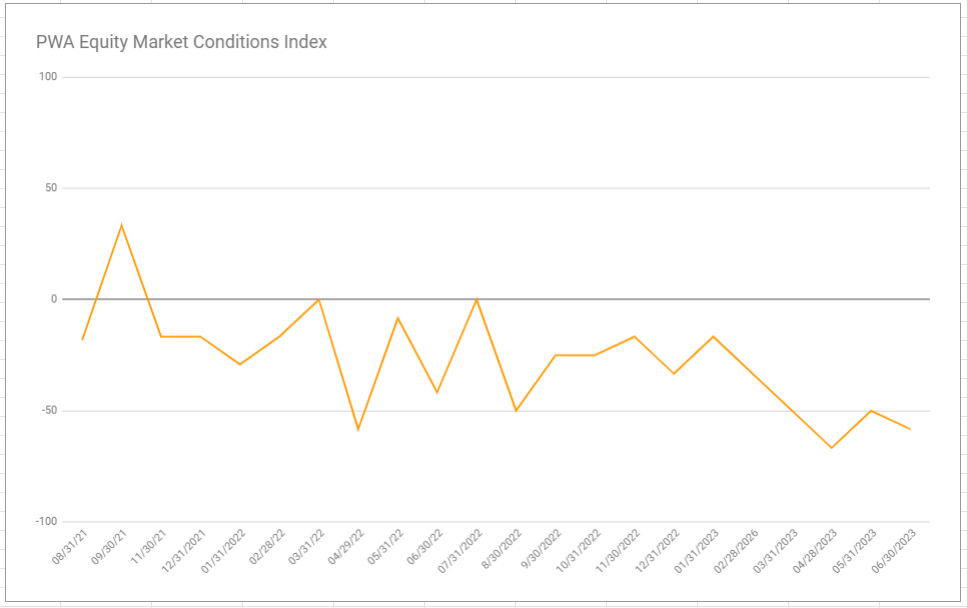
6/30/2023 PWA EQUITY MARKET CONDITIONS INDEX (EMCI): -58.33 (-8.33 from 5/30/2023)
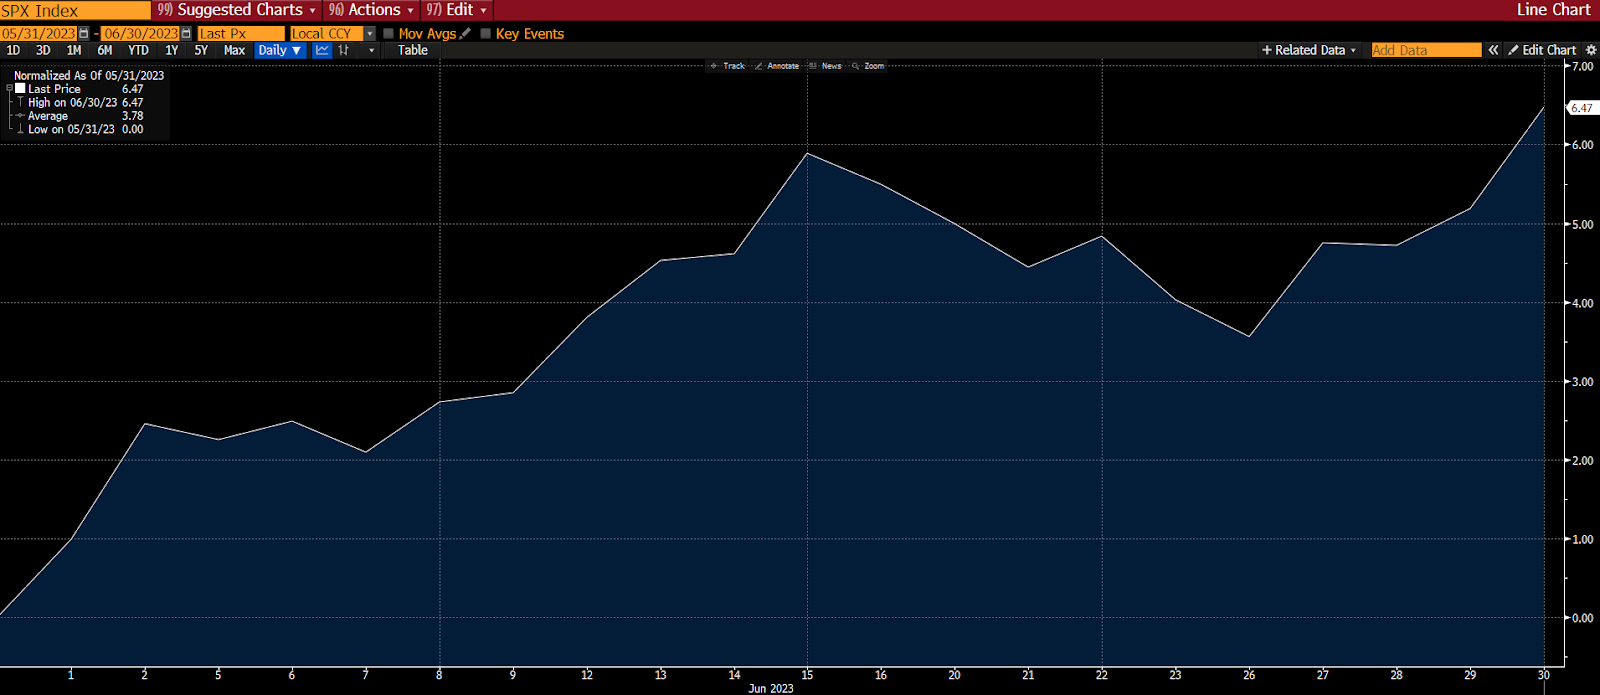
SP500 past 30 days, +6.47%:
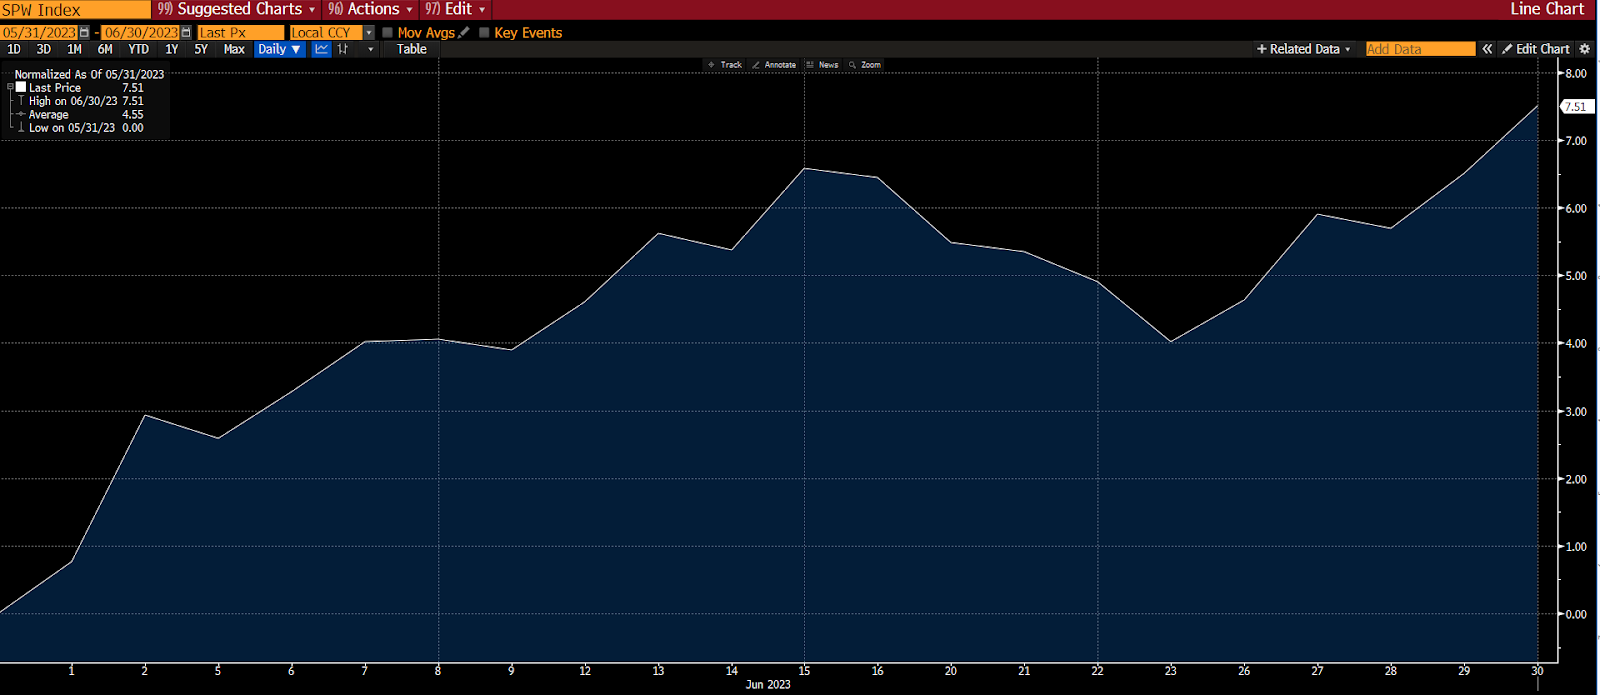
SP500 Equal Weight past 30 days, +7.51%:
After a notable improvement reflected in our end-of-May report (+16.67 points), amid nevertheless negative overall conditions, the EMCI resumed its bearish trend, dropping 8.33 points by the end of June.
In our previous update we flagged the potential for equity market strength in June based on a then bearish-dollar (bullish stocks) setup, and a softer-sounding Fed (and favorable inflation base-effects)… I suspect those factors – plus massive FOMO among investors – were not-small with respect to June’s strong rally.
Here’s from last month’s report:
“...a potentially-bearish technical pattern for the dollar (bullish for equities) along with a softer tone from the Fed (a no hike decision in June is highly probable) combines to perhaps justify continued sanguinity for the time being – considering how we view prevailing short-term trading biases.
Throw in favorable inflation base effects over the next two months and you have a narrative for stocks to perhaps remain buoyed over the next several weeks.”
And:
“...if the rally continues we anticipate capitulation (buying) among investors/traders who were bearish coming into the year.”
As we sit here today, however, that bearish dollar (bullish stock) setup has pretty much turned on its head… Our present technical analysis of the dollar now reads bullish (bearish stocks)... Plus, the Fed has flipped its messaging as well, going from a softening of their rhetoric in May to notably more hawkish messaging in June… J. Powell is signaling not-small odds of 2 more hikes before the end of the year.
I.e., the two factors that had us signaling potential strength in June, no longer offer such support.
That said, the past month did deliver a bullish go-forward signal in sector leadership (materials, industrials and discretionary outperformed the S&P itself, and, markedly-so, they outperformed the economically-defensive sectors as well) – taking its score from neutral to positive… And breadth, while still not nearly flashing green, showed notable improvement, taking it from negative to neutral in our overall scoring.
With regard to that “capitulation buying" mentioned in last month’s report, the following from Cem Karsan in last week’s Top Traders Unplugged podcast I think resoundingly captures the underlying setup and its evolution thus far this year, and the risk going forward:
"Judging from everything we're hearing, everybody's ratcheting up future expectations, everybody's talking about the new bull market, we've had a complete about face in the last 3 months, never mind the last 6 months, in sentiment and in positioning that really is accelerating here... I think that's important.
Markets are a reflexive machine, you can have negative, really negative, macro flows and macro issues, and markets generally hang in longer and go counter to what you might expect -- things can stay irrational longer than you can stay solvent... And that's because of reflexivity, because of the simple fact that people are positioning to hedge against that.
Ultimately that positioning itself gets squeezed out, and the macro realities still remain.
When you think about the last 6 months, we had a big overhang from a macro perspective, major issues that are well documented, well understood, with bearish positioning... At the end of the day what that leads to is a shaking of bearish positioning, and these things end in time and price.
Whether it's the real estate bubble that we knew about in '06 that didn't burst until '08... Whether it's the tech bubble, which we knew about in '98 and '99, which didn't burst until 2000... Whether it's as simple as a shorter-term timeframe as covid, which we knew about in December of 2019, but didn't decline until mid-February... These things need to move in price and time in a way that shake shorts and conviction, and reflexively undo themselves.
So that is what we have seen in positioning: Positioning was, on all metrics, incredibly, historically, bearish at the beginning of this year... And that critical point is what has driven these flows.
The macro picture, in reality, has actually continued to get worse... When I say worse, just from a liquidity perspective, dollars and cents, systematically, has gotten worse... I'm not talking about geopolitics really as much, or other things, the simple liquidity situation is significantly worse."
"It's all about timeframes, I don't think I emphasize this enough, and I think in the back of peoples' heads they understand -- but, for the most part, people think that if they're bullish for the next 3 years they should be buying, and if they're bearish for the next 3 years they should be selling, it's kind of a set-it-and-forget-it thought process...
Unfortunately, that's not how these markets work; you can have 30-40% index moves up (if not more) in the context of a very bearish topping process... Again, we've seen this during the tech bubble, we've seen this during the great financial crisis -- bigger numbers... I don't have the numbers in front of me, but in '99 to 2000 I think the Nasdaq doubled in the last 3 to 6 months, before it declined by 90+%."
Inputs that showed improvement:
Sector Leadership (from neutral to positive)
Breadth (from negative to neutral)
Inputs that deteriorated:
US Dollar (from neutral to negative)
Fed Policy (from neutral to negative)
Sentiment (from neutral to negative)
Inputs that remained bullish:
none
Inputs that remained bearish:
Interest Rates and overall liquidity
Valuation
Economic Conditions
Geopolitics
Credit conditions
Inputs that remained neutral:
Fiscal Policy
SPX Technical Trends
EMCI since inception:
SP500 since EMCI inception:

US DOLLAR: -1 (-1)
Last month's bearish technical assessment played out precisely as the setup suggested it would, with a 1.36% decline in June for the US Dollar Index (DXY):

Our current view of how equities are trading relative to the dollar, had us scoring the bearish dollar chart setup as neutral (+1) in our June report… Clearly, given the impressive 6.47% June gain in the SP500 (7.18% for SP500 EW) the negative DXY/SPX correlation is one to be respected.
One month later, technically-speaking, the dollar scores net-bullish (bearish stocks), having broken solidly above its June downward channel, with generally bullish shaping MACD and RSI:

Therefore, given the negative correlation, equities face a potentially-stiff dollar headwind heading into July.
No comments:
Post a Comment