
You've noticed that I feature two volatility measures in each morning note; reason being, they can be telling.
The VIX index tracks a key metric, "implied volatility" for S&P 500 Index options, in the standard options pricing model.
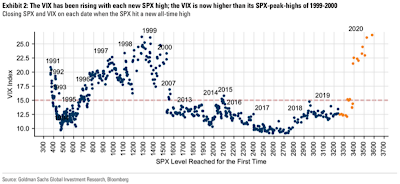
As it stands presently, its level happens to be the highest ever recorded when the S&P 500 is at an all-time high. The previous record happens to have been, you guessed it, at the peak of the tech boom:
So, does this mean that today's sharp selloff is the beginning of something much much bigger? Nope, today could absolutely turn out to be your classic head fake. It's just that, as I keep pounding herein, the risk of something much bigger is markedly elevated right here. In other words, the character of the market internals I've been pointing to of late is how it'll look ahead of the next precipitous selloff, whenever it occurs...
Speaking of today, FYI, as I type:
Dow's down 826 points (-2.84%)
S&P 500's down -3.50%
Nasdaq's down -4.78%
Russell 2000's down -2.88%
PWA Core Portfolio (100% allocated) is down -1.28%
No comments:
Post a Comment