
In this year's lengthy final letter we touched on the importance of tracking the trends and momentum in data versus in (or in addition to) stock prices. We tackled the debt bubble and how policymakers are working toward a Japan-like outcome. We explored the good, the bad and the ugly of the current stock market setup. We illustrated why we like commodities going forward. We broke the U.S. equity market down by sectors. And we explored a bit outside U.S. borders...
In this concluding Part Eight we'll take one more look at the current stock market setup, we'll ponder what a post-COVID economy portends, and we'll finish up with where we see true opportunity.
I'll start by pointing out 3 key characteristics of today's equity market environment:
1. There's a bubble in people who think stocks are in a bubble. I.e., everyone (well, not quite everyone) "knows" it's a bubble.
2. While there are of course those companies whose share prices are utter fantasy relative to their fundamentals, in truth this bubble is much more than simply those obvious bubble stocks, it's really a large-cap-growth-stock bubble. I.e., valuations are at record, or near-record, highs virtually everywhere we look in the growth space.
3. Most of the large cap stocks in this particular bubble, however, have real businesses with strong fundamentals.
Looking at it through the above lens, perhaps indeed this time is different -- given that the crowd, or a crowd thinks we're in a bubble (and you know what I preach about crowds ultimately being wrong), and that the companies that actually constitute the bubble are, as businesses, fundamentally strong -- perhaps this market isn't in fact destined to devastate the other crowd that's responsible for those 10 bubbly charts I featured in Part Four.
Here's from that section:
"Well, unfortunately, the level of stock market support by policymakers isn't the only thing we're seeing "like no other time in history."
While our own fear/greed barometer, as we've been reporting on the blog, says that optimism over stocks presently sits at the extreme, the following charts from Sentimentrader are chilling when we consider the history of what tends to happen coming off of periods of euphoric sentiment:
"Dumb Money" (the pejorative moniker for the retail investor) Confidence is at an all-time high:

Inflows into Exchange Traded Funds are nearly off the chart:

Foreign investors are piling into U.S. equities:

Mutual funds are sitting on their lowest cash reserves ever (imagine the selling they'll have to do [and its impact on stock prices] should sentiment suddenly shift):

Active portfolio managers are leveraging their bets to historic levels:

Options bets on a rising market are at an unbelievably historic high!

The lack of portfolio hedging among professionals (not us) is remarkable:

The level of the stock market relative to GDP (Warren Buffett's favorite valuation metric) is way into all-time high territory:

Concentration, as a % of total assets, in the stock market is right at historic (dotcom bubble) highs:

Ironically, there is one group out there who doesn't seem to be buying into the euphoria.
And, while, clearly, few are paying attention, my, given this group's vantage point, how they should be!
Corporate insiders (the company's execs themselves) are staying far away from their own companies' stocks:

While I could supplement the above with at least as many additional valuation charts, sentiment charts, etc., you get the point.
The market is offsides like, frankly, I've never seen in my 36-year career!
Which, by the way, given all of that top-down support, in no way means that a major crash is imminent. It does mean, however, that, absolutely, the risk is there!"
"Be humble.
For bears, it's easy to call a bubble. Anybody can do that. Timing is the hard part.
For bulls, it's easy to point to the fundamentals. Historical investors weren't dumb. The hard part is matching fundamentals with price..."
As I suspect you've pondered, COVID changes things big time in the workplace. And/or, we might say, COVID has accelerated preexisting trends in the workplace -- per the following from the World Economic Forum's The Future of Jobs Report 2020, published in October:
"The COVID-19 pandemic-induced lockdowns and related global recession of 2020 have created a highly uncertain outlook for the labour market and accelerated the arrival of the future of work."
"The adoption of cloud computing, big data and e-commerce remain high priorities for business leaders, following a trend established in previous years."
"In addition to the current disruption from the pandemic-induced lockdowns and economic contraction, technological adoption by companies will transform tasks, jobs and skills by 2025.""By 2025, the time spent on current tasks at work by humans and machines will be equal.""A significant share of companies also expect to make changes to locations, their value chains, and the size of their workforce due to factors beyond technology in the next five years."
"On average, companies estimate that around 40% of workers will require reskilling of six months or less and 94% of business leaders report that they expect employees to pick up new skills on the job, a sharp uptake from 65% in 2018.""Eighty-four percent of employers are set to rapidly digitalize working processes, including a significant expansion of remote work—with the potential to move 44% of their workforce to operate remotely."
And, make no mistake:
"...inequality is likely to be exacerbated by the dual impact of technology and the pandemic recession."
Although I'd say "by the triple impact of technology, recession, and what amounts to utterly egregious government-funded bailouts of junk debt-hoarding hedge funds and private equity firms."
If you think 2020's stock market action remotely discounted the changes (read risks and opportunities) to come, I'm afraid you'll need to think again.
Now, in the near-term, if you're thinking that there's a spending boost coming around the time folks are lining up for their vaccine booster, I hear ya! In fact, Wall Street's betting on it, big time!
In an article titled The Year When Everything Changed, The Economist magazine's December 19th edition points out that in the aftermath of the devastating Spanish Flu pandemic of 1918, Americans had "an appetite to live the 1920s at speed." And predicts that "that spirit will also animate the 2020s."
And, honestly, I don't doubt it... well... I don't doubt that we'll see a spending boost once folks feel it's safe to hop a plane and/or to book a cruise. The sustainability of such a boost, however, I question.
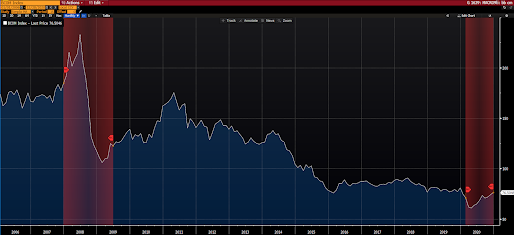
One big problem I have with The Economist's 1920's analogy -- aside from the huge fact that during the Spanish Flu personal income didn't in the aggregate actually rise year-over-year (via generous government transfer payments), and retail sales didn't set new records; both surreal COVID-Era phenomena that beg the question, how much of that pull-forward spending will affect future activity? -- is this chart I've featured more than once on the blog:

This time I added blue X's where debt to GDP and interest rates sat heading into the Roaring 20s and where they sit today.
Today looks much more like the end of a debt cycle than it does the beginning of one, which is anything but a bullish endorsement for stocks.
I.e., sustainable bull markets tend to emerge from economic setups consisting of higher interest rates (that can come down), and low debt levels that allow room for the private sector to borrow, spend and invest. The exact opposite of the current setup!
Recall in Part Three we discussed how Japan in the 1990s came to grips with the peaking of their own long-term debt cycle; by choosing to borrow and spend to virtual infinity to keep the markets from dealing with the bubble the old fashioned -- and quite painful -- way.
Here's from that section:
"Here’s a look at Japan’s GDP (orange) in nominal terms. Note the utter stagnation these past 25 years. (US nominal GDP in white):
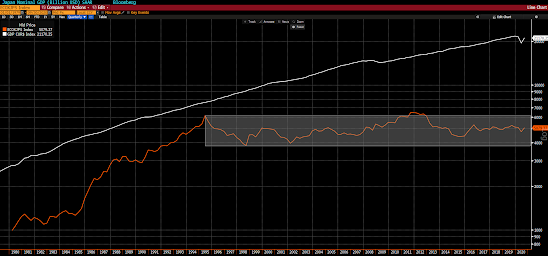
And note the incredible rise in Japan’s government debt (bottom panel) -- now 264% of GDP -- while the economy has done essentially nothing:
I.e., Pain-aversion (and, thus, stagnation) comes with a very high price tag!
As you might imagine we can carry this on for volumes... there's so much to parse and consider in today's macro setup.
Thus, there'll, as usual, be a constant flow of evolving content coming your way in our daily blog posts and in our deeper-diving weekly messages and macro updates going forward.
Our aim is to keep you clients informed as to what we're seeing and thinking as we perform our ongoing research.
For the moment, we can sum things up on our end by stating simply that our conclusion, with regard to equities, is that the fundamentals across most (i.e., as we've reported, and expressed in portfolios, we do see a few pockets of legitimate opportunity) sectors are the definition of suspect.
And historically-speaking fundamentals have always, eventually, mattered. Time will tell if that remains the case this go-round.
"While I say we are in a bubble, I'm not saying it is impossible to invest in a bubble -- just know the environment and make sure you have some hedges."
When it comes to commodities, and commodities stocks, however, as I reported in Part Five, while we expect plenty of volatility going forward, the long-term fundamentals are very compelling right here.
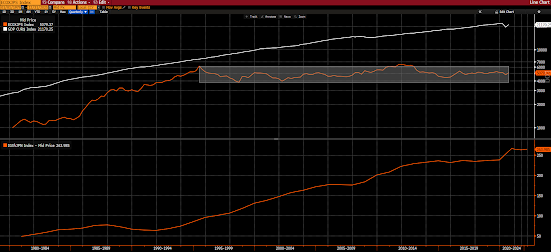
We'll close with the simple trend comparison vs stocks featured in that section (the entire piece gives you our full take on commodities):To simply, and vividly, illustrate my point in terms of the attractiveness of commodities vs stocks, take a look at a 15-year graph of the Bloomberg Commodity Index:
versus the S&P 500 Stock Index:

Side note: Funny how stocks are about the only thing I can think of where the more expensive they get, the more folks want them... Even in real estate, you never hear that it's a "buyers market" when prices are at record highs.... Think about it...
Bloomberg's index, by the way, contains everything from crude oil to live cattle:

Singling out industrial commodities, here's the CRB Raw Industrials Index. Note that, despite having rallied strongly this year, it remains ~20% below it's 2011 China-induced peak:

So, again, we like commodities right here!"
While, yes, the calendar has turned, suffice to say that there remains much to play out in terms of the economic and financial market developments and trends of 2020.
I won't say that we're still early in this particular ballgame, but I'm quite certain that we're nowhere near its end.
Thanks for reading!
And Happy New Year!!Marty
2020 was a particular year for everyone, and Progressive Web Apps are .In terms of innovation in the PWA space, it was the laziest of the last.Using data from AppBrain Stats we can conclude that 12% of apps in . Windows 7 and 8.x.Apple released with iOS 14, AppClips.www.talktoace.com
ReplyDelete