
From this morning's log entry:
6/17/2024
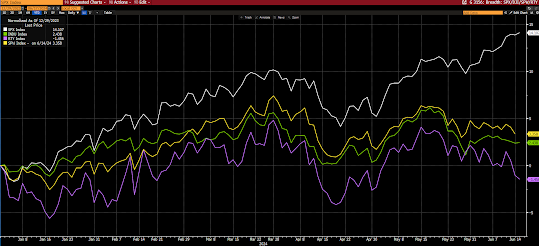
Per the below, stock market breadth is absolutely abysmal… While we’ll remain open minded (and last year the market rose amid often-week breadth) history – when we’ve seen this magnitude of breakdown – does not support a happy ending:
SP500 vs SP500 Equal Weight (yellow), Dow Jones Industrial Average (green) and the Russell 2000 (purple) YTD:
SP500 vs SP500 Advance/Decline Line YTD:

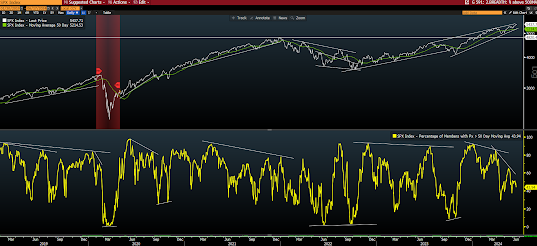
SP500 vs number of members trading above their 50-day moving average:
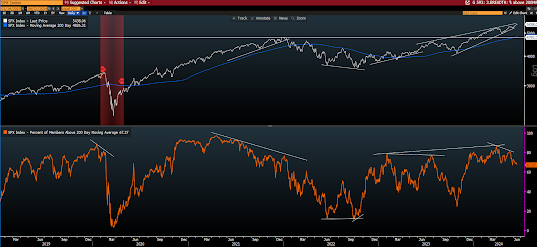
SP500 vs number of members trading above their 200-day moving average:
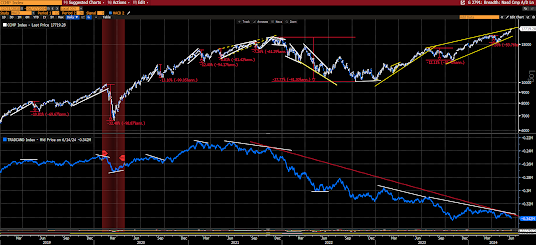
Nasdaq Comp vs its Advance/Decline Line:
No comments:
Post a Comment