
Dear Clients, despite the Nasdaq sitting at, and the S&P 500 near, all time highs, this week's highlights from our internal log will not inspire confidence in the go-forward setup for stocks... Which, by the way, in no way means that the next bear market is imminent... It simply means that the risk is historically high right here, and that liquidity, diversification, and, in our view, hedging here and there with options is these days more than warranted.
In our candid view, prudent long-term investing is all about knowing when, and when not, to add risk... Suffice to say that today's overall setup is not the sort that you find at the early stages of a sustainable equity bull market... One could argue quite the opposite, in fact.
6/18/2024
Like I said yesterday, regarding breadth:
Stocks Trade Like the March 2000 Dot-Com Era PeakBy Cameron Crise
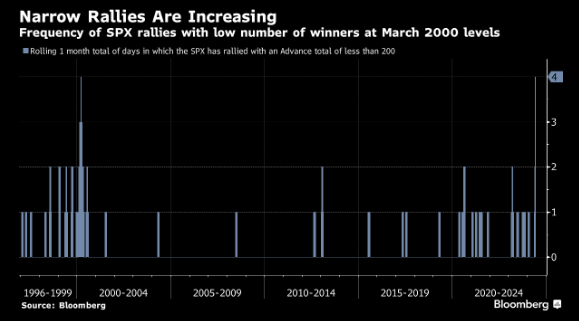
(Bloomberg) -- US equities closed at all-time highs on Thursday, though you might not know it from looking at a random list of single-stock performance. Indeed, a little less than half of the members of the S&P 500 are trading above their 50-day moving average, and only 43% of the broader Russell 3000 can make that claim. That’s an unusual set of circumstances, to say the least. Even odder is that fact that twice this week, the SPX has managed to rally with less than 200 individual names up on the day. That’s a testament to the top-heavy nature of the market. But over the last month that sort of thing has happened with a frequency that we’ve only seen once before in nearly three decades worth of data: March 22 of 2000, two days before the dot-com era peak in the S&P.
A funny thing happened on the way to the equity rally yesterday. After the close, I had a look at a list of about 20 stocks that I like to keep an eye on. Only five them were up on the day, which seemed a bit unusual given that the S&P and Nasdaq complex had managed to eke out a rally. I decided to look a bit further under the hood, and what I found was pretty messy.
The first port of call was to check out the SPX Advance index, which simply measures how many index constituents rally on a particular day. Only 185 names finished in the green yesterday, so clearly the single-stock scuffles were not isolated to the list that I happened to look at. In poring through a time series of the Advance index, I noticed something odd; on Tuesday, the market also rallied with just 182 names up on the day.
That seemed a bit unusual, so I decided to tot up a rolling one-month tally of trading days in which the SPX finishes higher with an Advance index reading of less than 200. It turns out that it’s happened four times since May 28. Going back to the inception of Advance index data in 1996, the only other time we’ve seen narrow rallies with that sort of frequency was the aforementioned observation in March of 2000.
Now, while that sort of thing is a headline-grabber, it does not necessarily mean that the equity market is going to top imminently. Still, the frequency of the observations does seem to say something about the nature of the market; narrow rallies occur more often when valuation is elevated and concentrated within a small cohort of names. That’s been the case recently as investors make the individually-rational decision to chase performance (either by allocating directly to the tech/AI mega-caps or by purchasing index product, which is tantamount to the same thing.)
I looked at some other metrics to get some more perspective on the nature of the market. First, I tried to put the confluence of the S&P trading at all-time highs with a majority of members trading below their 50-day moving average into some sort of context. The scatter below overlays the two series using daily observations going back to 1990. Over the sample period, there have been 698 separate closes at all-time highs.
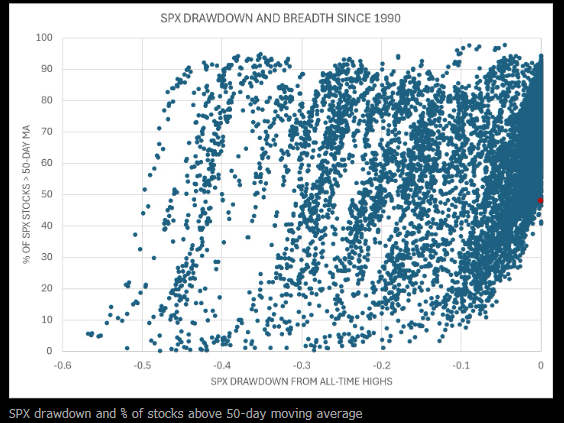
Just 13 have seen less than 50% of member stocks trading above their 50-dmas. Two of them came in June 1998, a couple of months before a Russian default rattled global markets and led to the LTCM crisis. Three came in December 1999, three months before the dot-com equity peak. Four came in June of 2021, which admittedly was months before the SPX ran into trouble, but did mark a secondary high for the likes of ARKK and uber-speculative stocks. The last four have come this month.
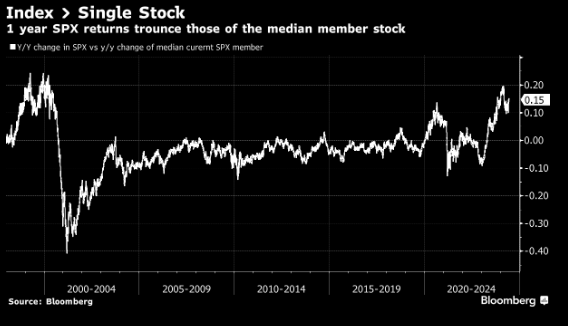
Does this mean that the market peaked on Thursday, or is set to do so next week? No, you can’t draw that sort of conclusion from this sort of thing. What you can say, though, is that the margin for error is narrowing considerably as returns become concentrated in a small group of names. Another way of articulating this is to look at the performance of the index versus its median constituent. The chart below shows the y/y change in the SPX minus the median y/y change among current member stocks. As you can see, in normal circumstances the spread is fairly minimal, but this year has ballooned to its widest since the dot-com peak. Put another tick in the “yup, it’s a bubble” column.
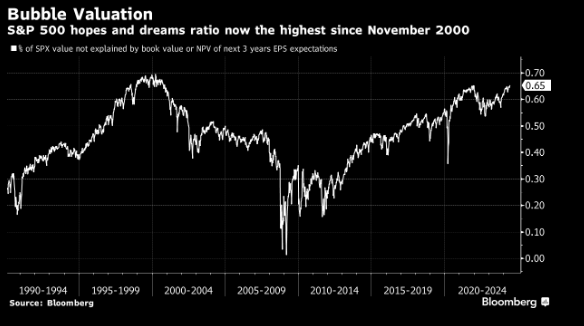
Finally, we should look at valuation, specifically through the prism of the hopes and dreams metric that captures the portion of equity index valuation explained by earnings into the distant future. The messaging is quite similar; hopes and dreams are now at the highest level since November of 2000 but aren’t quite yet at the level of the dot-com era peak.
So that’s four metrics that point to similarities with the dot-com era. That’s supportive of the stance that this commentary has adopted this year — namely, that stocks trade like a bubble, it’s silly to take significant risk in trying to call a top, and the most rational approach is to ride the wave while trailing stops higher using some sort of momentum model. Based on recent price action, though, it’s probably worth double-checking those levels.
6/18/2024
Excellent thread from Bob Elliott:
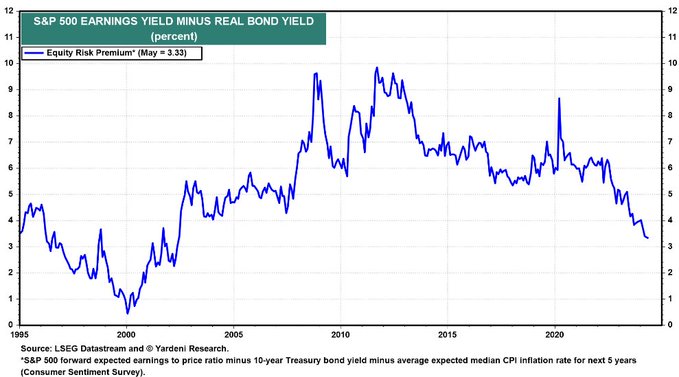
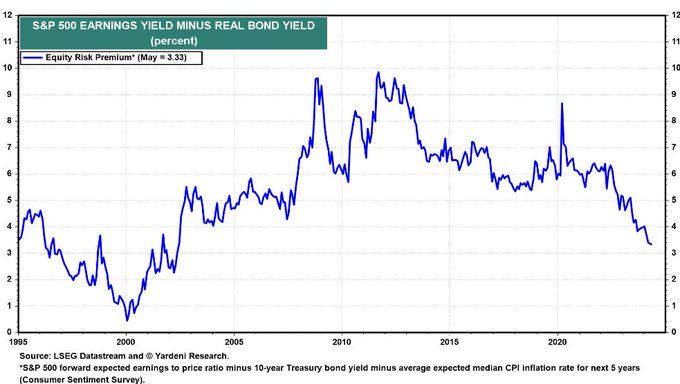
Yield is destiny for medium-term asset returns and today there just isn't much yield buying risky assets. Term premium, equity risk premium, spread premium all remain at multi-decade lows which means that asset returns over cash are going to look poor in coming years. ERP low:
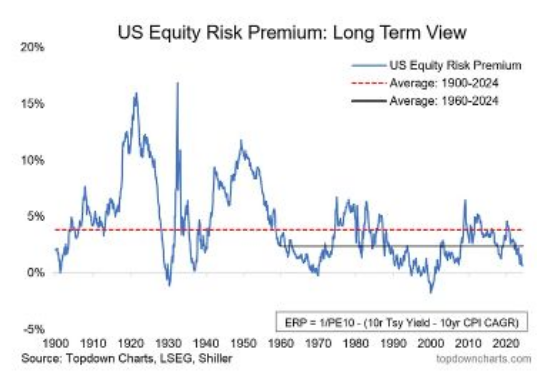
And a slightly different version of the measure with a much longer time frame h/t @topdowncharts. 1929, 1937, 1970 and 2000 were all poor times to add equity risk to a portfolio in the past.
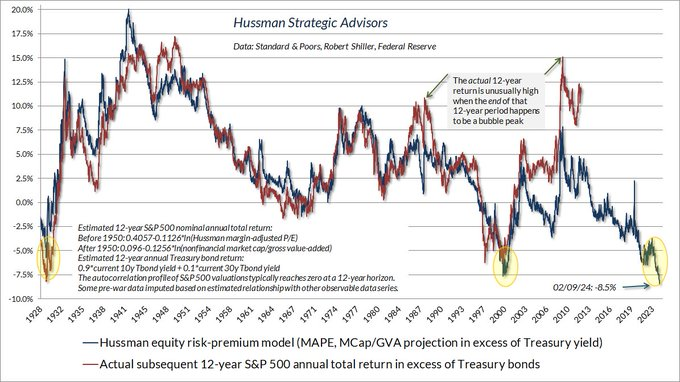
When risk premiums are as squeezed as these are in stocks, future returns have ended up quite weak. h/t @hussmanjp
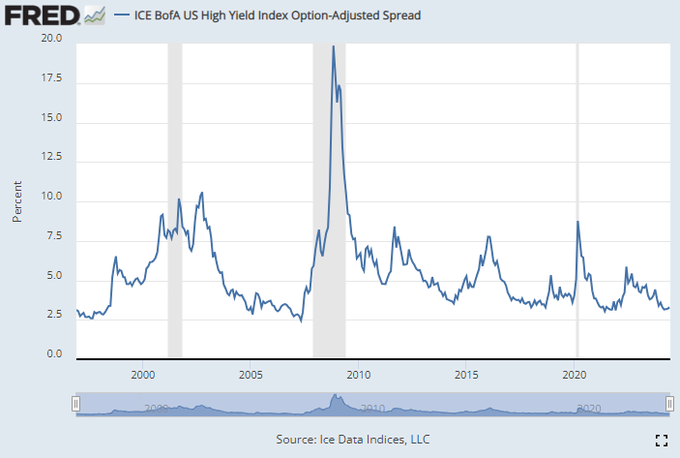
And the yield on spreads is basically at all-time lows as well, which doesn't bode well for the expected returns of those products. The last time spreads were at these levels it was '97 and '07, and we all know how those turned out...
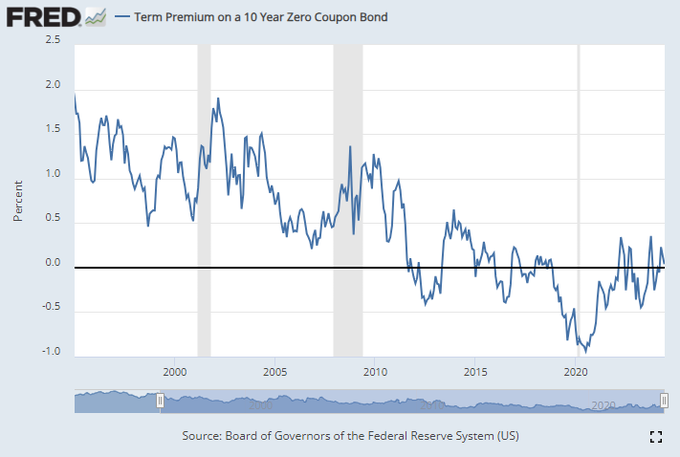
Term premiums in bonds are also compressed, certainly relative to any sense of historical norm. At zero by this measure, estimate is roughly consistent with the post-GFC average where the Fed needed to do financial repression to pull the US out of an acute deleveraging dynamic.
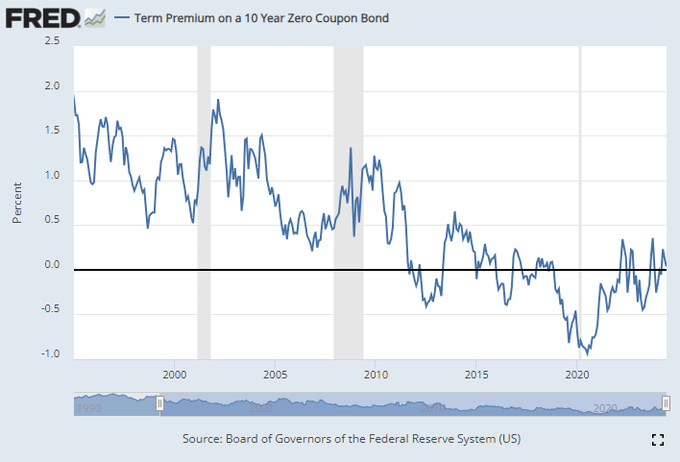
At this point investors are getting very little yield for moving from cash to long dated assets, and very little yield moving from low risk assets like bonds to higher risk assets like equities and corporate spreads.
For investors with a medium-term time frame (which is the vast majority of investors & advisors) chasing the new highs here may get the next ticks in the equity markets, but it is setting up for disappointment for building longer-term wealth.
The pressure to chase is very strong and the cost of cutting back looks high in the short-term. These yields could easily tighten further and prices could press higher which makes it even more difficult to be prudent at this point. Momentum and peer risk are powerful forces.
But in the medium-term assets at these prices are highly unlikely to deliver returns commensurate with their risk. Prudence in building long-term savings is hard in the face of euphoria. But its clear that levering up at these prices will be met with regret in years to come.
6/17/2024
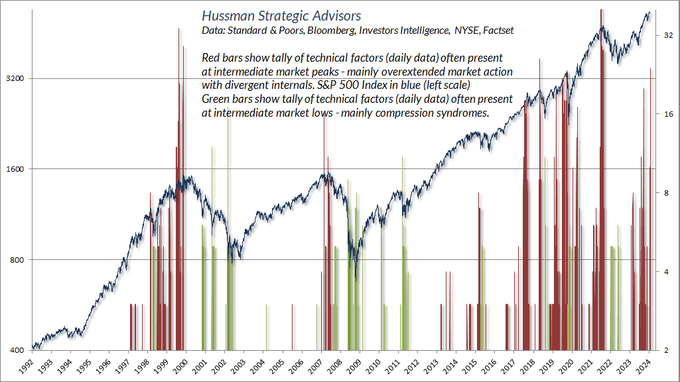
John Hussman:
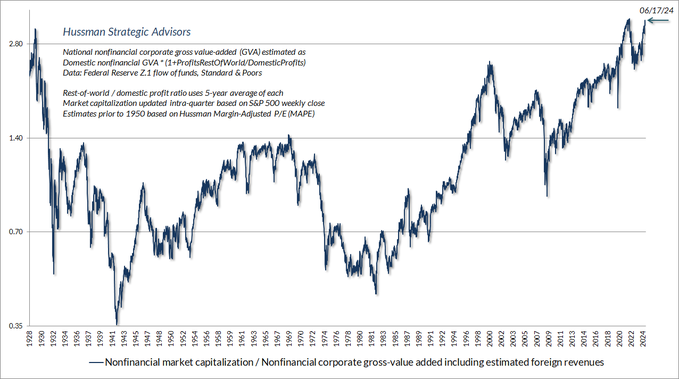
Quick update: Our most reliable gauge of valuations exceeds every point in history, including 1929 and 2000, except for 6 weeks surrounding the 2022 peak. Of course, if extreme valuations were enough to drive the market lower, one could never reach extremes like this.
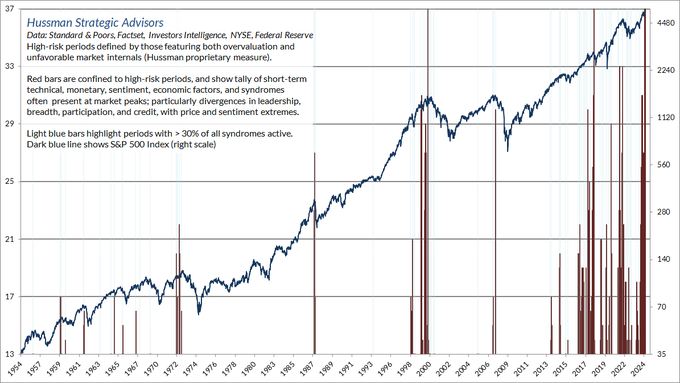
Market internals remain unfavorable and are deteriorating quickly, so there's an open trap door, but even internals don't label extremes. "At present, the 'last straw' of market action that deserves monitoring in daily data relates to 'leadership.'"

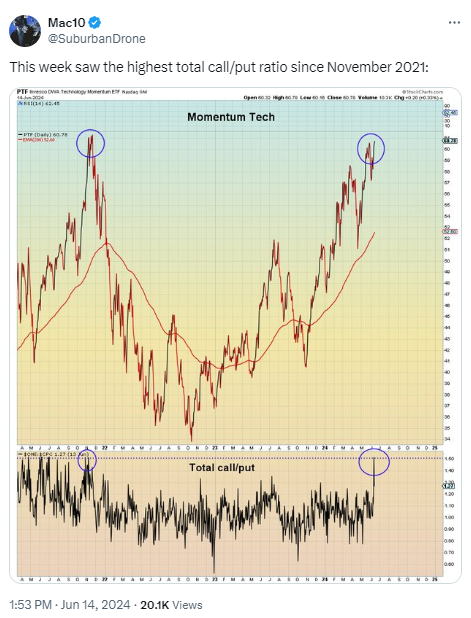
Once extreme valuations and deteriorating internals open a trap door, it's then that overextended conditions become worth monitoring. Last week's tally of warning syndromes in weekly data eclipsed the November 2021 "Motherlode"
In daily data, here's something you don't see very often - a 5-year high with negative leadership, particularly coupled with an absence of bearish sentiment. We did see that today.
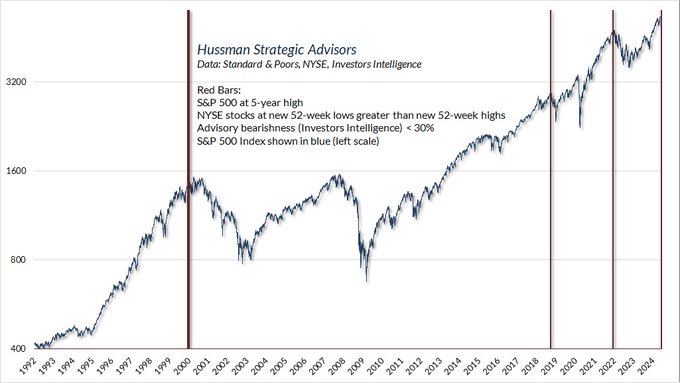
We also saw dozens of other warning syndromes today in daily data. That combination of a fresh high with deteriorating internals feels excruciating for hedged equity strategies, but it's also a sign to review risk exposure. Not a forecast. Not a top call. Just sharing data FYI.
6/17/2024
Heading into the 2022 bear market:
6/17/2024
Bob Elliott makes an excellent case for caution – or low expectations for the rest of the year – with regard to stocks right here:
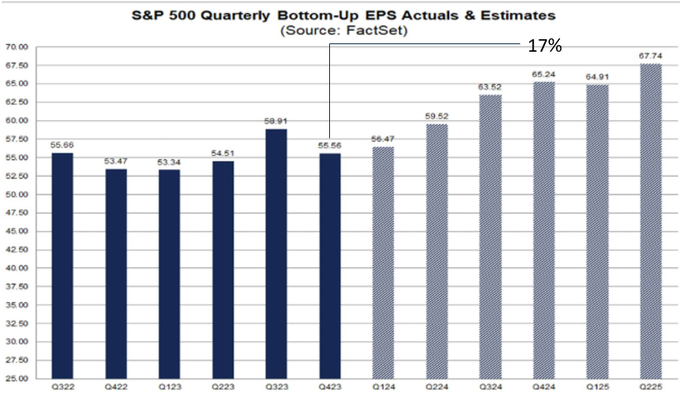
High growth expectations and depressed risk premiums is a challenging setup for strong overall stock market returns ahead. Earning growth expected to be 17% y/y by 4Q, which would require a pretty big acceleration from the trend of the last 6q just as the econ is softening.
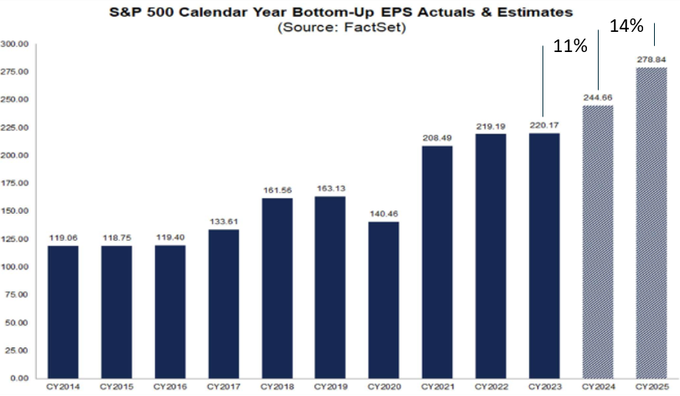
And earnings growth is expected to accelerate in 2025 relative to 2024.
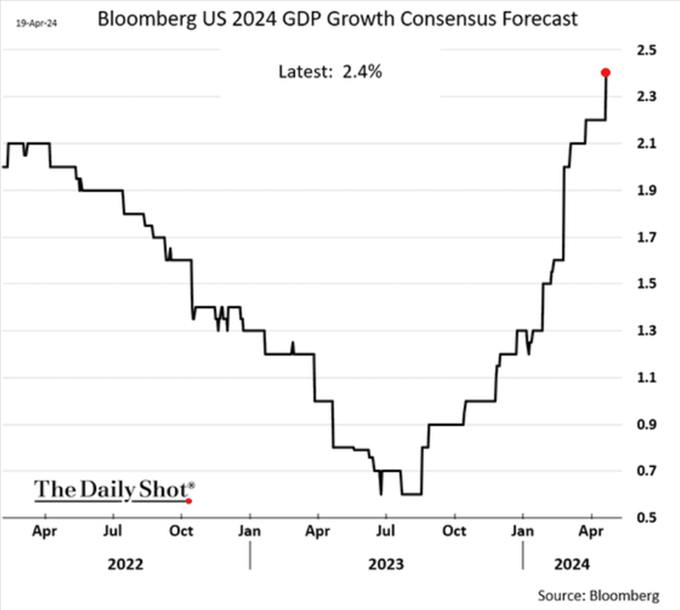
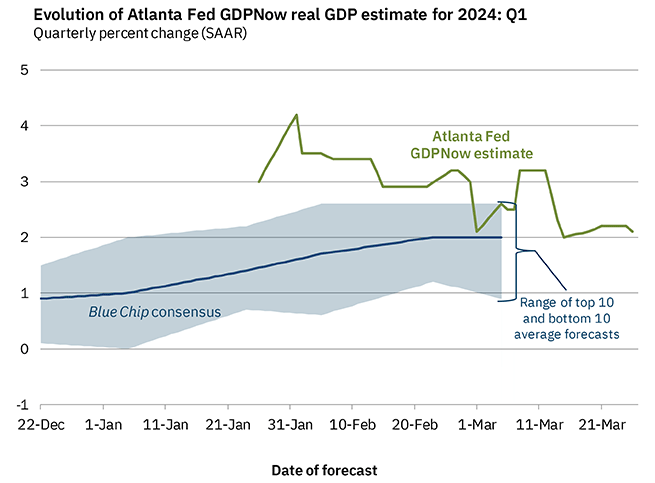
Further overall economy growth expectations are also very elevated. With consensus expectations of US growth running around 2.5% for the full year 2024. That requires nearly 3% growth for the rest of the year given the soft 1Q print in the low 1%s
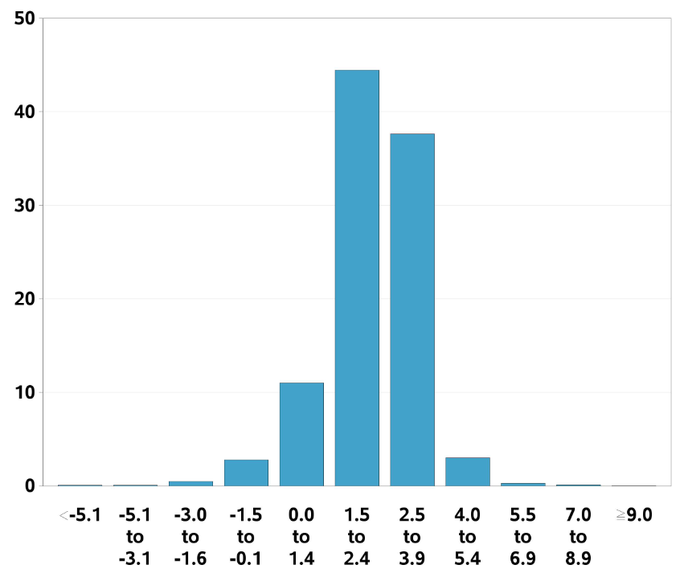
With more than half of economists expecting growth to be over 2.5% for the year. Not that surprising given the mean, but still there are many economists expecting *very* strong growth at this stage of the cycle.
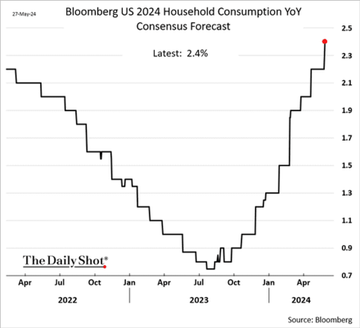
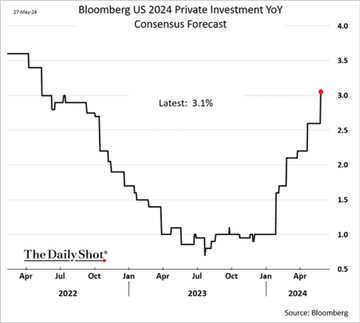
Expectations are that this will be powered by a combo of very strong real demand and investment.
This comes at a time when the risk premium to hold stocks versus bonds is about as low as it has been in decades.
And the risk premium to hold bonds vs. cash is roughly zero.
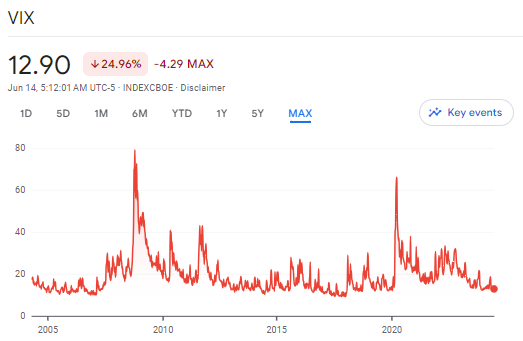
And risk priced into the markets is at all time lows.
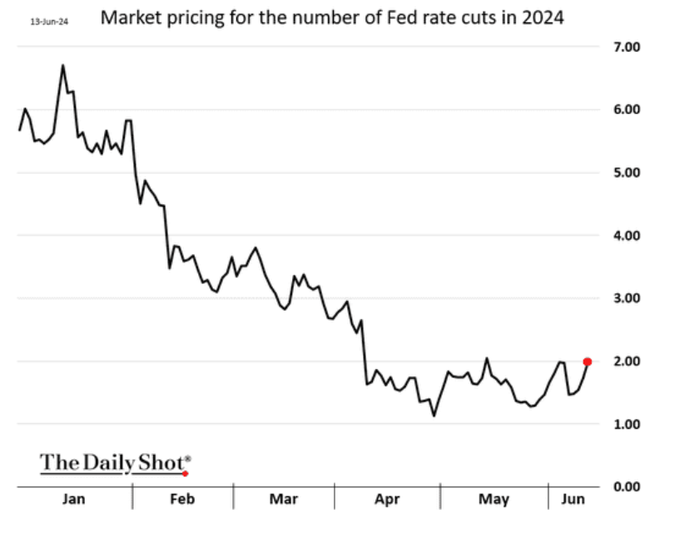
And expectations of monetary policy easing ahead in '24 is already at the higher end of the Fed's expectations. Meaning its hard to get much more easing priced in from here.
Getting further stock rises here will require one of the following: - Higher than already very high expected earnings growth - Higher than already very high expected economic growth - Further compressed risk or term premium - Easier than expected monetary policy
None of those different levers look all that compelling looking out the rest of the year. Probably the most promising from a fundamentals perspective is a shift to easier monetary policy given some indications of inflation moderation, but that will be tough without soft growth.
Of course euphoria could also take hold driving valuations even higher / risk premiums even lower than the current already stretched levels, but that's really a bet on a greater fool theory rather than one based on fundamentals at this point.
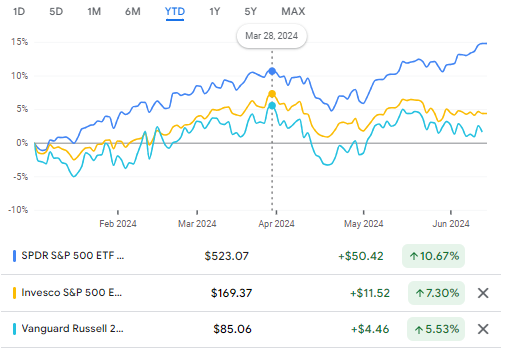
Much of the stronger for longer view that was very non-consensus to kick off the year became consensus by the end of 1Q. Since that point S&P500 has only delivered about 2% returns over cash, not a great risk/return bet and much weaker than 1Q.
"Stronger for Longer" outlook to kick off '24 did well in Q1. As did the clear trades given it: 1) long stocks vs. bonds & 2) short dec24 sofr. But the view ahead is pretty different. Stronger for longer is consensus, with much more uncertainty ahead.
And would have likely been even weaker on a mkt-cap basis were it not for much higher than expected outcomes for a very small handful of companies essentially capturing share in the overall equity market.
Macro investing is all about making probabilistic assessments of the likely future path of the economy and asset prices based on what's priced in today. When you look at the equity market today, the paths to further upside surprises look limited, and the comp to hold low.
6/17/2024
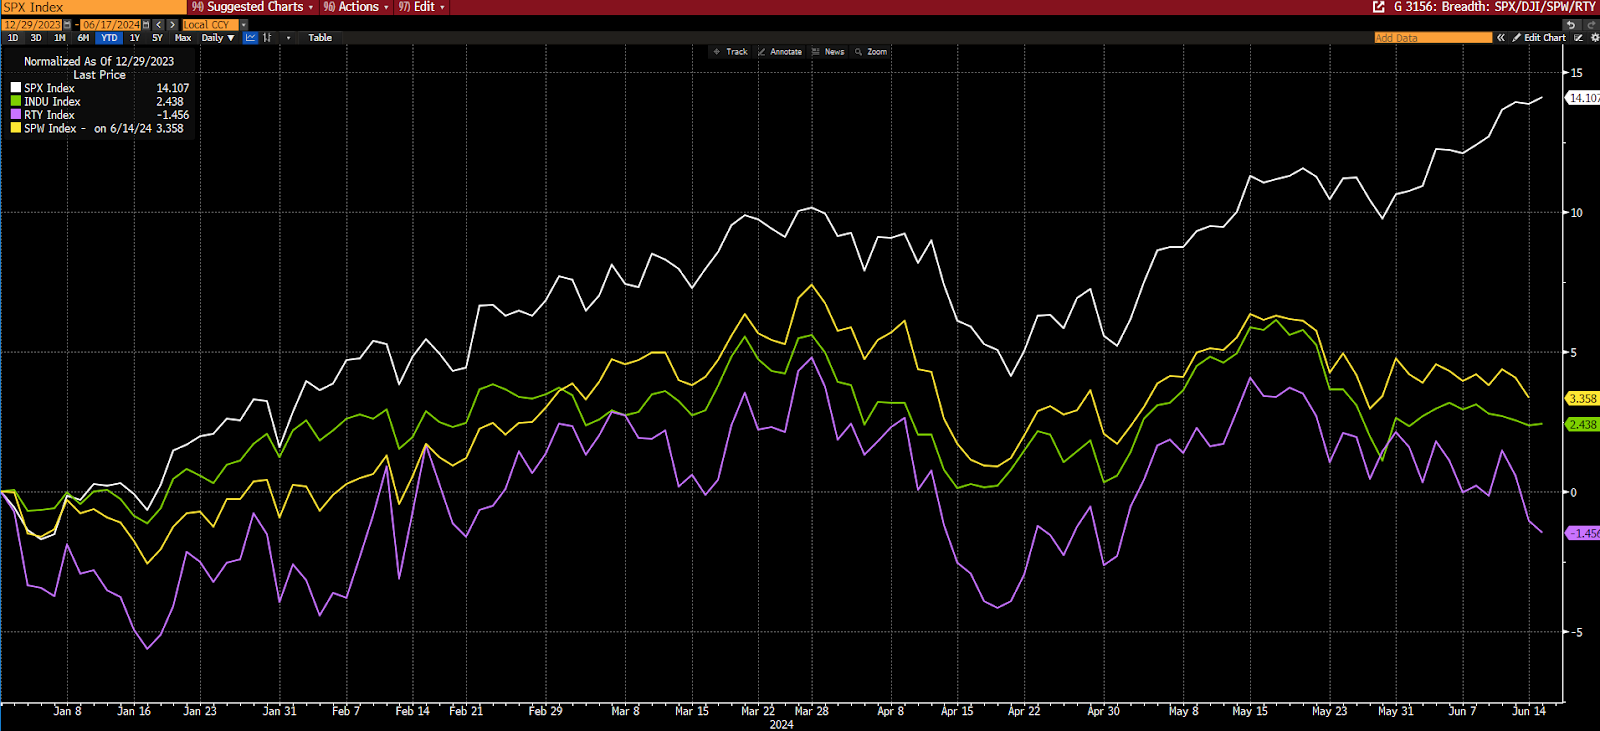
Per the below, stock market breadth is absolutely abysmal… While we’ll remain open minded (and last year the market rose amid often-week breadth) history – when we’ve seen this magnitude of breakdown – does not suggest a happy ending:
SP500 vs SP500 Equal Weight (yellow), Dow Jones Industrial Average (green) and the Russell 2000 (purple) YTD:
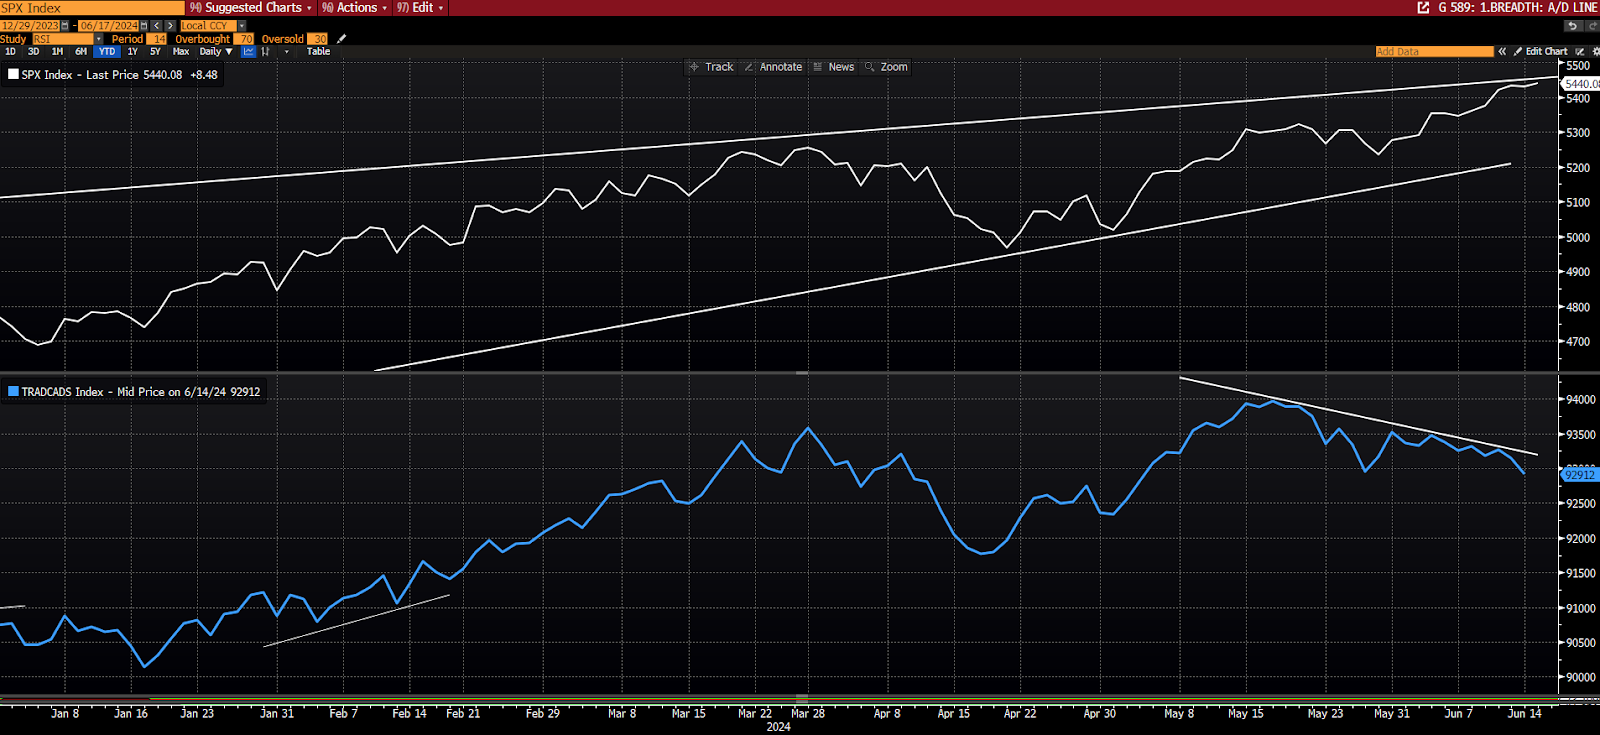
SP500 vs SP500 Advance/Decline Line YTD:
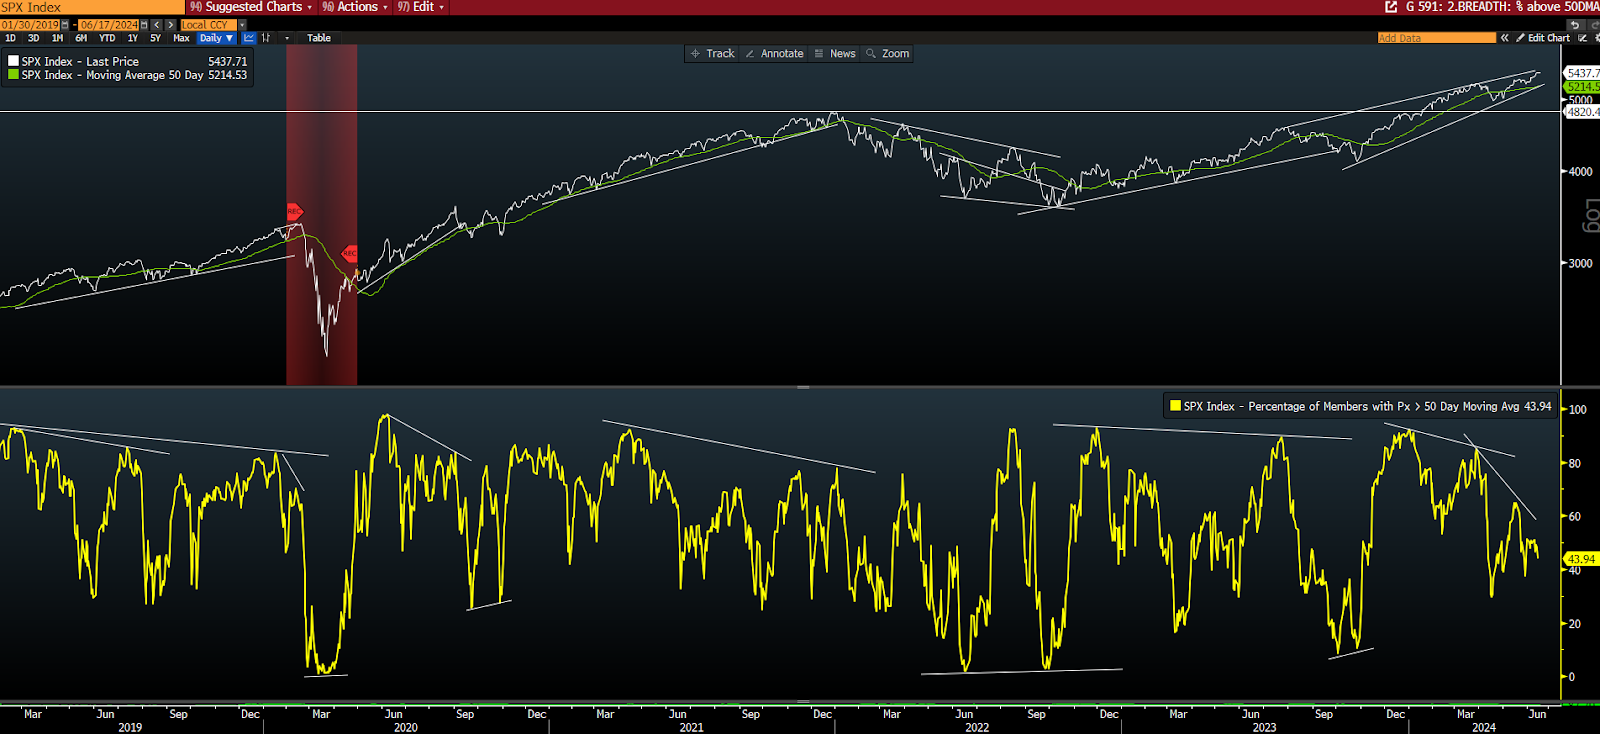
SP500 vs number of members trading above their 50-day moving average:
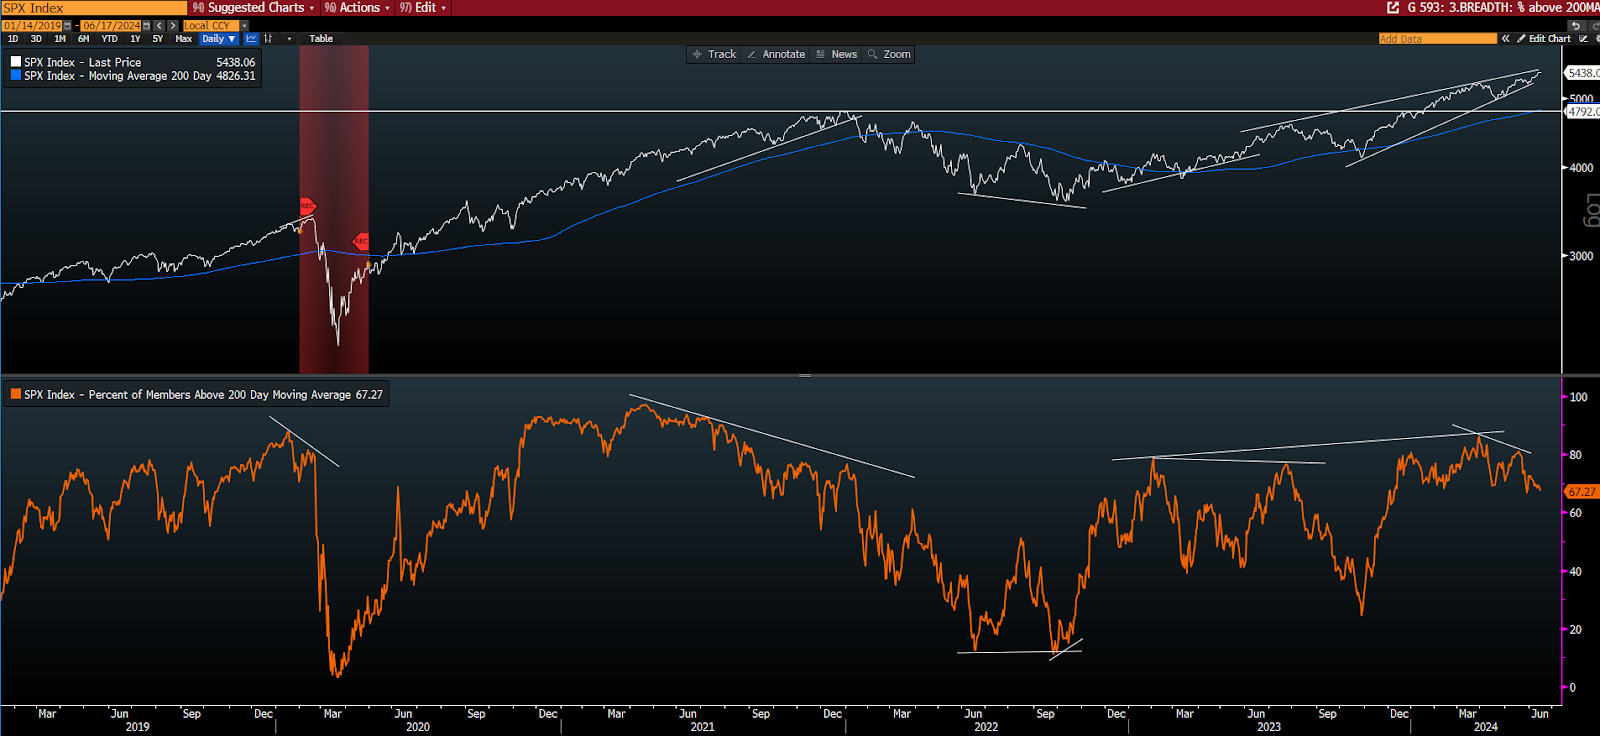
SP500 vs number of members trading above their 200-day moving average:
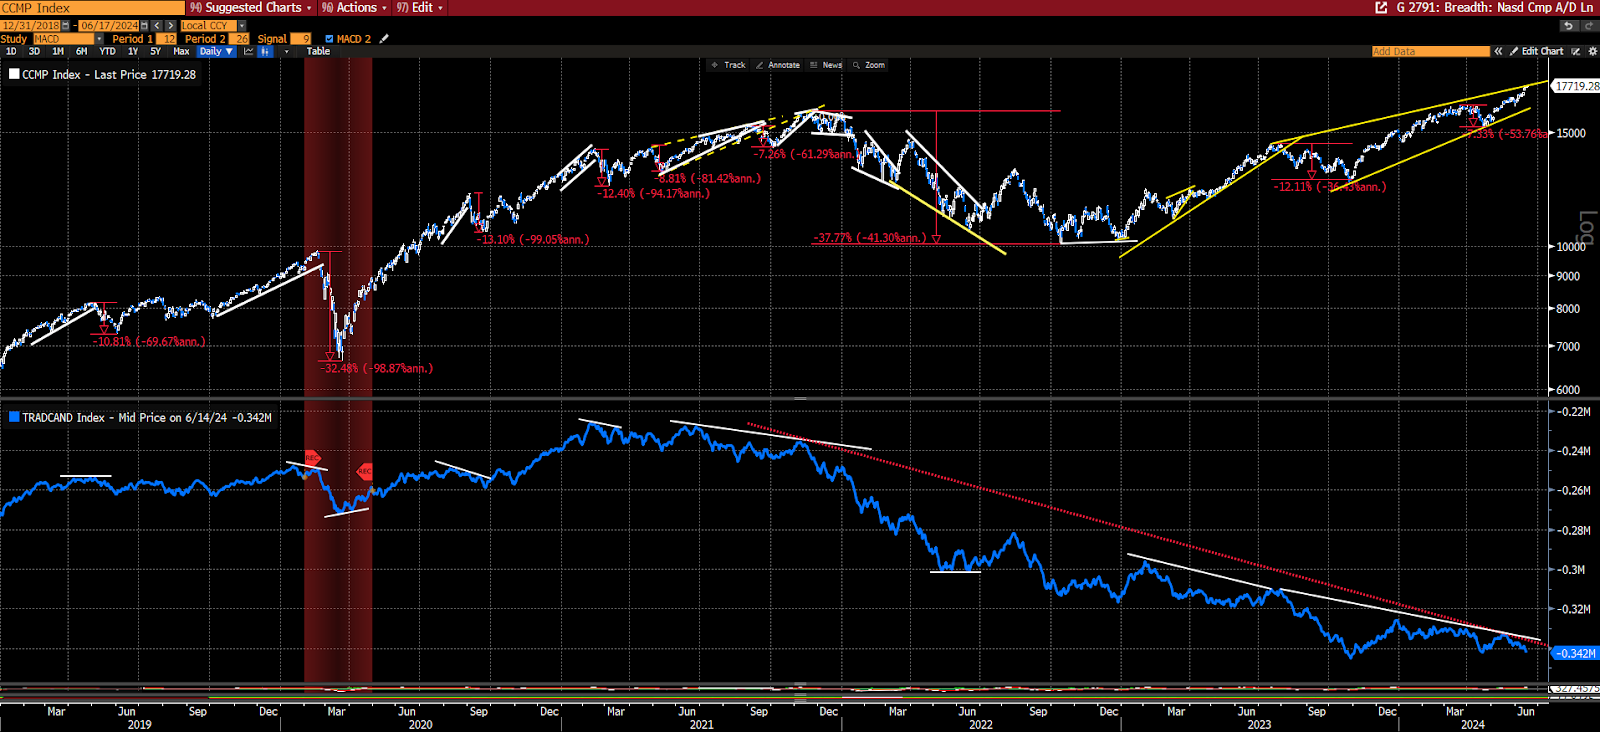
Nasdaq Comp vs its Advance/Decline Line:
No comments:
Post a Comment