
Delivering this week’s update to you in written form.
The following is the long and the short of the latest on the economy, and on financial markets.
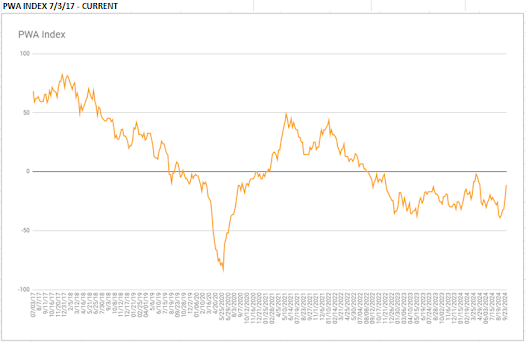
Our PWA Index (measures overall general conditions) rose markedly for a third straight week -- moving closer to the neutral line -- denoting improved conditions (i.e., recession risk remains elevated, but notably less-so of late):

The latest employment data, the ISM Services PMI for September, and the US Economic Surprise Index each received an upgrade in our scoring, while none of the remaining 41 inputs received a downgrade (although heavy truck sales, and the S&P Global PMI reading both came close)... Currently, 23% of our datapoints read positive, 25% negative, while 52% read neutral.
With regard to ISM services, while, again, the overall reading was positive, per the below (my highlights), things were somewhat mixed:

“Overall, economic factors are somewhat stable in the last month. Volatility was limited, based more on seasonal aspects than geopolitical issues or election season. That stability may be short-lived due to looming port labor issues heading into October.” [Accommodation & Food Services]
“Business has been flat over the past three to six months, with concerns over growth in the near term.” [Agriculture, Forestry, Fishing & Hunting]
“Housing construction continues to struggle with high interest rates. While the recent half-point cut is encouraging, it may take another 150 basis points to move the needle in sales. Labor and heating, ventilation and air conditioning (HVAC) regulations continue to be a drag on construction last month.” [Construction]
“Interest rates in both the housing and auto markets have been steadily declining, leading to a slight increase in auto and home loan applications.” [Finance & Insurance]
“Back orders from manufacturers have increased, resulting in supply constraints.” [Health Care & Social Assistance]
“New projects have not been consolidated in the U.S., which has led my organization to cut costs, especially by dismissing employees from departments with a lower activity volume.” [Information]
“There is concern over the economy, and it feels like a lot of people are waiting to see which way the election goes in November before making a solid plan for 2025 and beyond.” [Professional, Scientific & Technical Services]
“Prices remaining mostly steady, with a significant increase in fiscal year-end spending.” [Public Administration]
“Starting to see positive year-over-year change in sales. Slow but steady.” [Retail Trade]
“Sales have slowed a bit, with customers possibly holding back on new projects and awaiting the outcome of the presidential election.” [Wholesale Trade]
As for financial markets (scoring our index on a quarterly basis beginning this month), we'll touch on those by taking highlights from our latest internal report on equity market conditions:
09/30/2024 PWA EQUITY MARKET CONDITIONS INDEX (EMCI): -11.11 (+55.56 from 7/31 [scoring quarterly from here])
Despite a very bearish setup heading into August, equity markets (save for small caps) booked decent gains from July 31 (our last monthly assessment) to Sept 30… Although said gains all occurred during the last 3 weeks of September (as of 9/6 SPX was actually down 2.06% from 7/31).
Suffice to say that waning inflation, expectations of an oversized fed rate cut (which they gave) to begin a fresh easing campaign, declining bond yields and a falling dollar all converged to inspire sufficient FOMO (for equities) among those who were/are nervous about the global macro setup going forward.
Per the following report, equity market conditions, while still net negative, have improved markedly over the past couple of months.
While valuations and the longer-term technical setup remain notably negative, key short-term drivers – (financial conditions [fed policy, rates, liquidity, etc.], sector leadership and near-term economic conditions) – have us constructive on the equity market’s Q4 outlook, despite our slightly net-negative overall score.
Of course a sizable spike in volatility around the US election is a not-small probability along the way… Heightened middle-east tensions are a notable risk right here as well.
Inputs that showed improvement since our 7/31 report:
Interest Rates, Liquidity and Overall Financial Conditions (from negative to positive)
Sector Leadership (from negative to neutral)
Economic Conditions (from negative to neutral)
Inputs that deteriorated:
None
Inputs that remained bullish:
None
Inputs that remained bearish:
Valuation
SPX Technical Trends
Sentiment
Inputs that remained neutral:
US Dollar
Fiscal Policy
Breadth
COMPONENT ANALYSES
US DOLLAR: 0 (-1)
That bear flag pattern we pointed out in July played out, and some:
Despite the logic around the dollar continuing to descend from here (futures traders are expressing that anticipation as well), the current technical pattern says that at least a near-term bounce is presently on the cards… Correlations of late would make that net bearish for stocks.
Also, given the recent improvement in our own US economic analysis, plus rising liquidity, etc., we could very well see the market dial back it’s expectations of aggressive fed easing going forward – that would be decidedly bullish for the dollar.
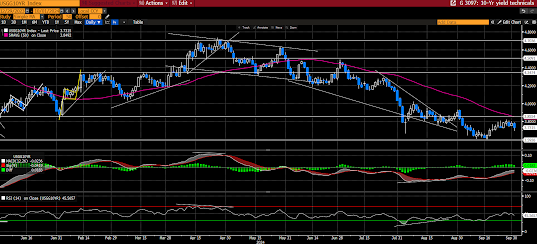
INTEREST RATES AND OVERALL LIQUIDITY/FINANCIAL CONDITIONS: +1 (+2):
The 10-yr treasury yield reflects expectations of future rate cuts, and presumably weaker economic conditions.
We’ll score the current technical setup as neutral:
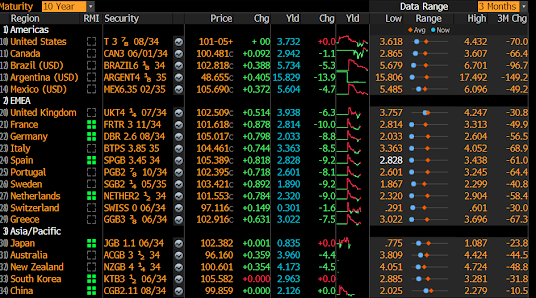
Global sovereign yields have declined across the board of late:
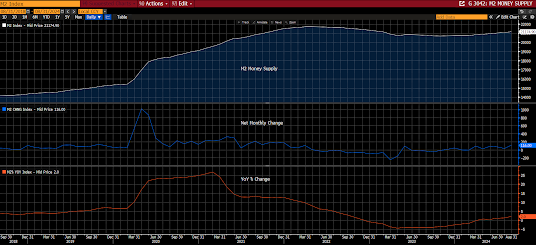
M2 has risen by $150 billion since 7/31 (1 month behind), to $21.175, up 2.0% YoY:
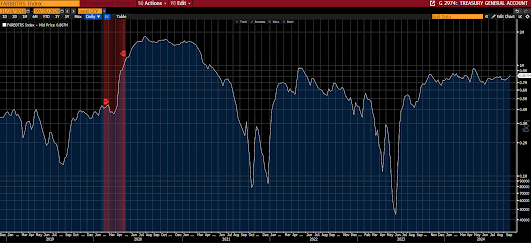
TGA rose to $807 billion (from $786 billion on 7/31):
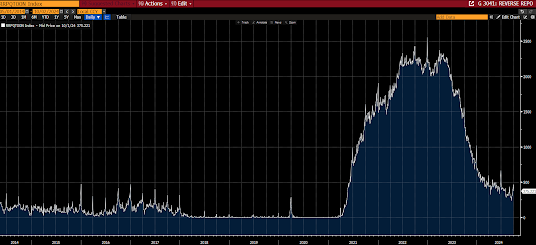
Reverse Repo balance rose to $375 billion (from $338 billion on 7/31):
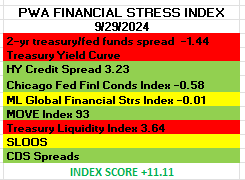
Our own “Financial Stress Index” – a look at potential stressors in the fixed income space – just flipped back into the green, denoting reduced stress in the system:
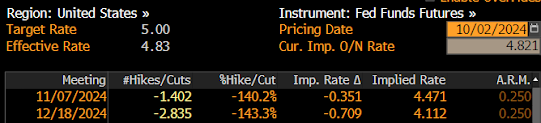
Fed funds futures positioning currently discounts 3 25bp rate cuts by year end.
US Fed funds futures forecast:
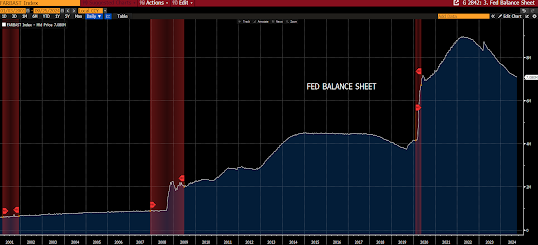
Fed Balance Sheet $7.08 trillion - a $10 billion decrease from 7/31:
Plus the following from our internal notes:
9/30/2024
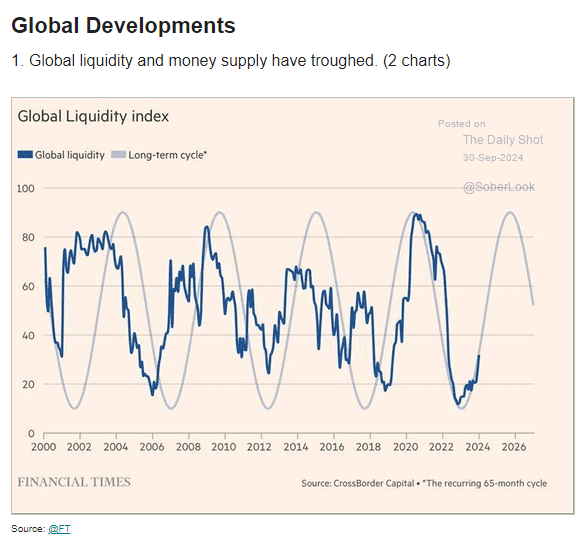
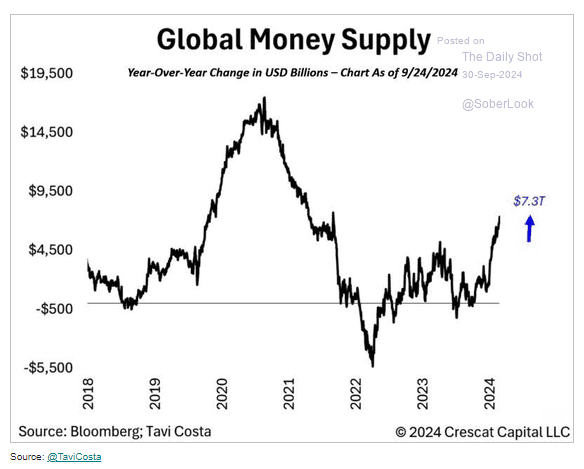
More liquidity charts out this morning; this is not bearish for asset prices!
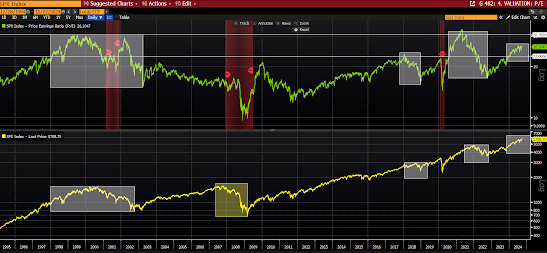
VALUATION: -1 (nc)
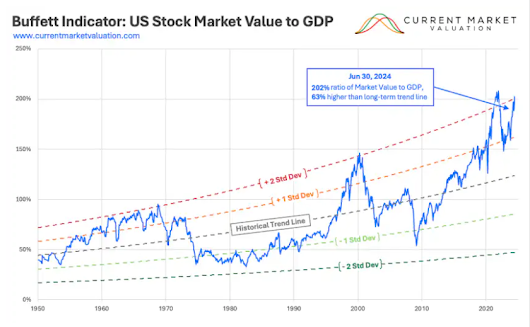
US equity market valuations remain historically-high:
P/E 26.10
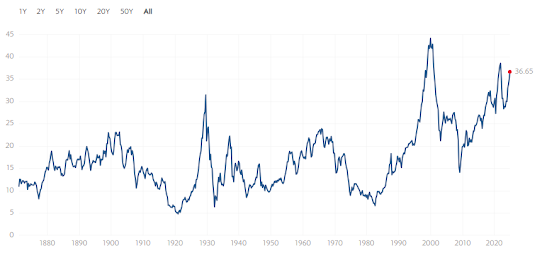
CAPE 36.65:
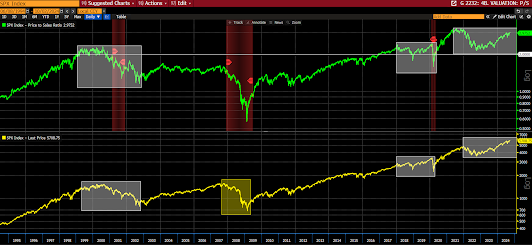
P/S 2.98:
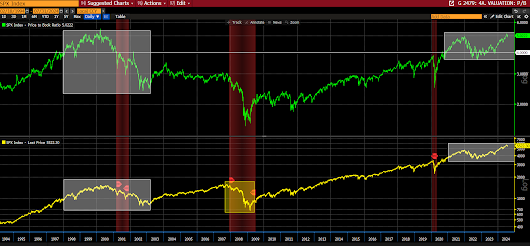
P/B 5.02:
MC/GDP 202% (Buffet Indicator):
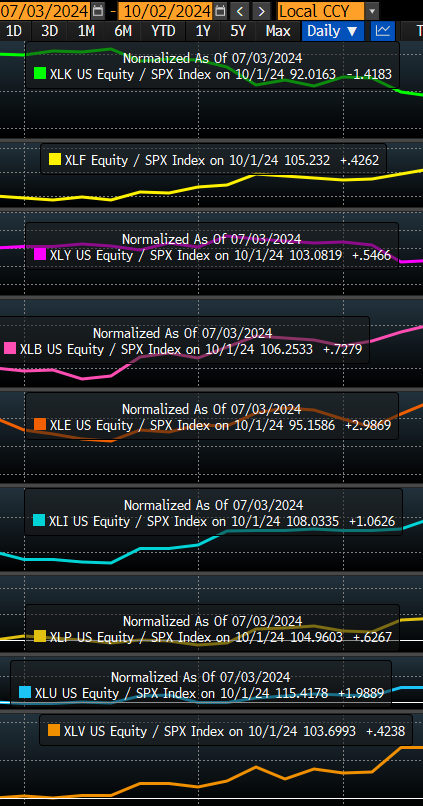
SECTOR LEADERSHIP past 3 months: 0 (+1)
Among growth/cyclical sectors: Financials, discretionary, materials, and industrials markedly outperformed SPX over the past 3 months, tech and energy largely underperformed. All 3 defensive sectors, staples, utilities and healthcare strongly outperformed SPX:
ECONOMIC CONDITIONS: 0 (+1)
The PWA Index: -11.36:
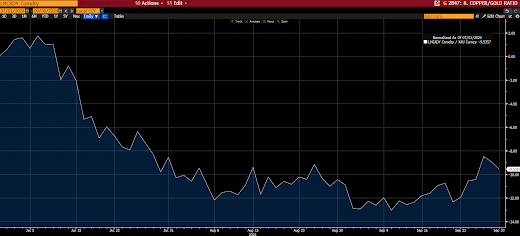
COPPER/GOLD RATIO past 3 months -9.55%, past month +1.52:
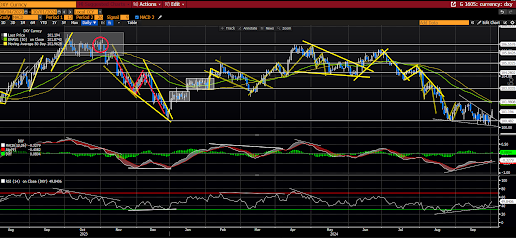
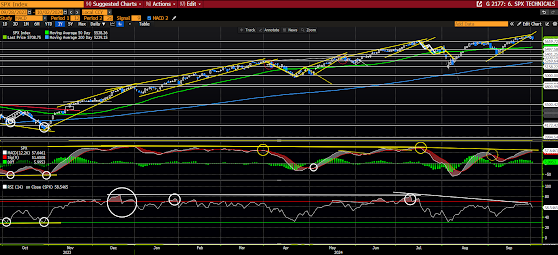
SPX TECHNICAL TREND: -1 (nc)
The technical setup on the daily chart reads bearish:
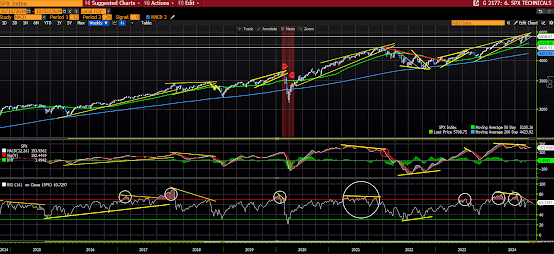
The weekly chart reads notably bearish:
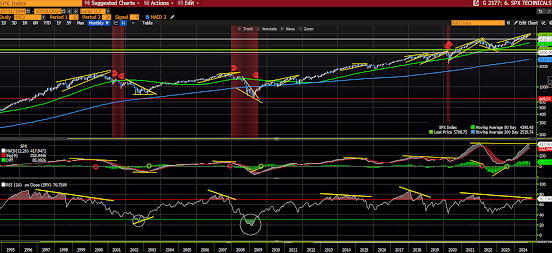
MONTHLY (notably bearish): MACD buy signal remains in place. However there are dramatice bearish divergences on the MACD and the RSI, with the latter dipping into rare overbought territory… While price is solidly in a rising wedge pattern:
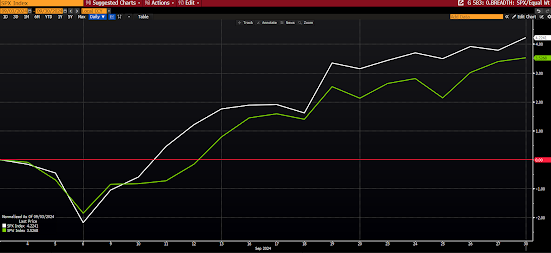
BREADTH: 0 (nc)
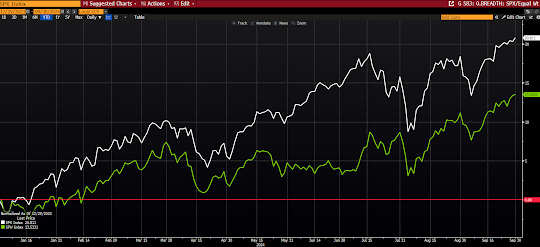
SPX/SPW spread deteriorated over the past month, with SPW gaining 3.5%, while SPX rose 4.2%:
Year-to-date continues to show very poor breadth:
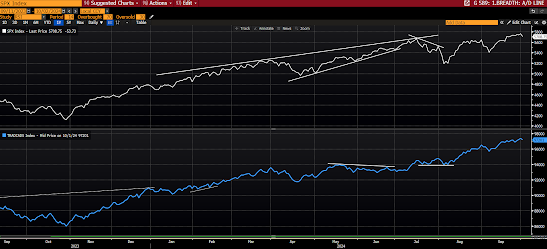
SPX A/D LINE: The A/D line essentially confirmed the recent all time high in price:
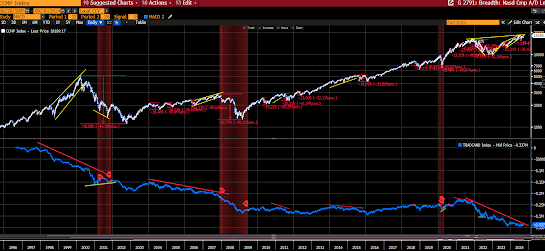
NASDAQ COMP A/D LINE: Massive bearish divergence remains (exceedingly ugly/concerning breadth):
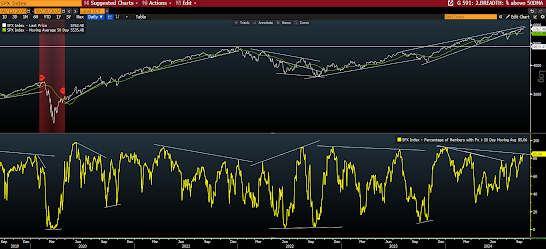
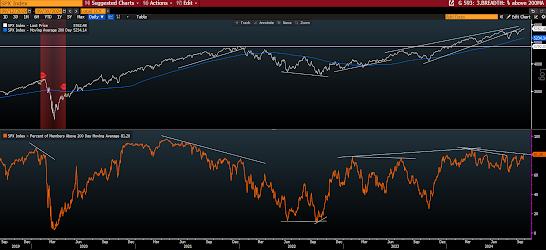
85% of SPX members trading above 50-dma, although that still represents a bearish divergence from the previous price peak:
81% above 200-dma (same bearish divergence):
SENTIMENT -1 (nc)
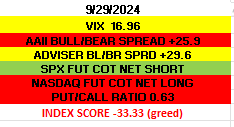
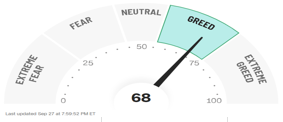
PWA fear/greed Barometer reads greed:
As does Citi’s Fear and Greed Index:
No comments:
Post a Comment