
In last Friday's video commentary I suggested that the then selloff lacked some potential to break key technical support based on an utter lack of volume.
Well, if a lack of volume diminished the probability that last week's selloff contained sustainable downside oomf, the same so far today must therefore (for the moment) diminish the probability that today's rally contains sustainable upside oomf... Although there's a compelling case to be made for a notable technical bounce given critical support levels maintained last week.
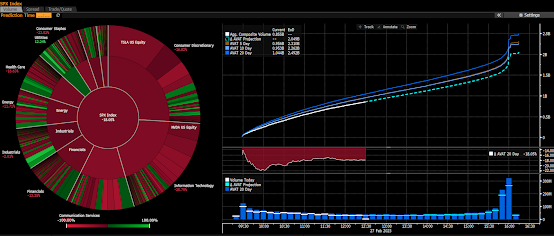
The dotted line represents today's trajectory of SP500 total volume, the solid lines represent 5, 10 and 20 day average volume:
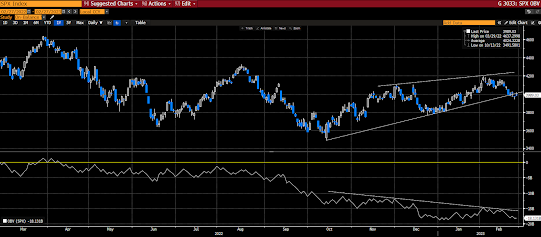
Now, the task is to see if there's a trend... One way to do that is to consider "on-balance volume." Which draws a line that accumulates volume based on total shares traded on up and down days... I.e., the line moves to the extent of total volume in the direction of the index's close vs the open: When the SP500 is down, the line moves downward to reflect all of the day's volume, and vice versa...
Note that while all indicators are imperfect, this one, over shorter periods in particular, is expressly so; in that should, say, the market go from green to red by a mere point during that last 5 minutes of the trading day, all of the volume that day will be credited to the downside, even though the market may have traded up virtually all day... Over extended periods of time, however, our assessment shows that it indeed has some predictive value.
Note the rising trend in SP500 price (top panel) off of the October low, versus the declining trend in on balance volume (bottom panel)... This would denote greater conviction on the down days vs the up days:
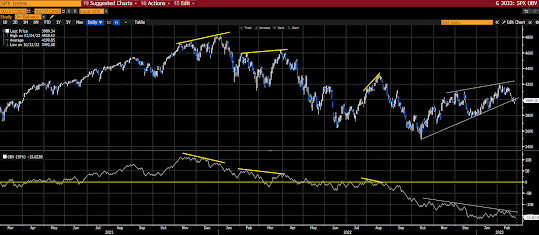
Consider the past couple of years:
Agree! Thanks Marty!
ReplyDeleteIt is mind-boggling that the Fed allows financial easing to run for this long. So far, data show that inflation is coming back hotter (history repeats itself like the '70). Gas price is on the rise. Rent is either flat or on the rise. If the Fed is really serious about containing inflation, they need to stop talking about disinflation. I have the following opinions with some key dates coming in March:
1. ISM (3/1. Probably hotter)
2. February CPI (3/14. Probably hotter)
3. PPI (3/15. Probably hotter)
4. FOMC (3/21-3/22. They need to tighten up the screw if they are serious)
5. Job Report (3/24)
6. PCE (3/31)
Hi Sam! good stuff! One thing to keep in mind is "base effects." Which reflect the fact that today's inflation prints are % changes from year ago inflation prints... I.e., when the change a year ago for a given month was high, it makes for an easy inflation comp now, as it gets compared to a month when inflation had ramped up... When the change a year ago was low, it makes for a tough inflation comp, as even a relatively small increase shows up as a notable current increase...
ReplyDeleteAs it turns out, the next few months (March, April, May and June in particular) make for easy comps; meaning all things equal, inflation will appear to be coming down -- so the increases you anticipate will at least to some degree be offset by these base effects... For the second half of the year, however, the comps get tough; meaning, all things equal, inflation will appear to be coming in hotter... Here's from Forbes on the topic:
For the first six months of 2022 the monthly increase in the Unadjusted Index was between 1.605 and 4.015 or 0.56% to 1.37% (see table below). This makes for easy compares or the Base Effects helping to lower the inflation rate in the first half of 2023.
After that the compares are much tougher as the month-to-month readings were two slightly negative readings in July and August, a small increase in September, a slightly larger increase in October and a larger drop in November.
The average change in the Index the last five months is a positive 0.43 with November’s decline of (0.301) or a negative 0.1%. Note that the Unadjusted Index is not seasonally adjusted vs. a seasonally adjusted month-to-month increase of 0.1% that is also announced in the CPI press release.
January: 2.346 or 0.84%
February: 2.568 or 0.91%
March: 3.788 or 1.34%
April: 1.605 or 0.56%
May: 3.187 or 1.10%
June: 4.015 or 1.37%
July: (0.035) or (0.01)%
August: (0.015) or (0.04)%
September: 0.637 or 0.22%
October: 1.204 or 0.41%
November: (0.301) or (0.10)%
Agree! Thanks Marty!
ReplyDeleteCPI in the 2nd half of the year will be much higher due to comps (like you said) and also due to China reopening its economy. I think the Fed will have no choice but to continue to increase rate to 6%. We will probably have a mild recession in the 2nd half of the year.
Makes sense to me Sam
Delete