
Check this out...
The circled area in the graph below captures a notable move in the futures market night before last:
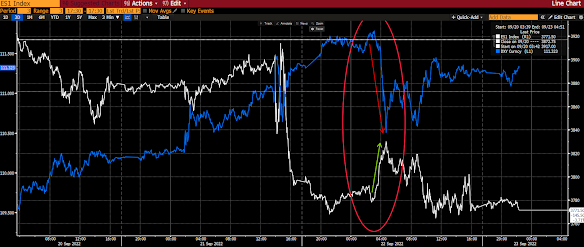
The white line represents the SP500 E-mini future contract, the blue is the US dollar index... Yeah, stocks were still reeling in the after hours session following the US Fed decision day. Until, that is, the Bank of Japan stepped into the currency market and sold dollars/bought yen -- sparking an impressive, although unsustainable, rally in equities.
Here -- 3-year chart of the yen in dollar terms -- is why:
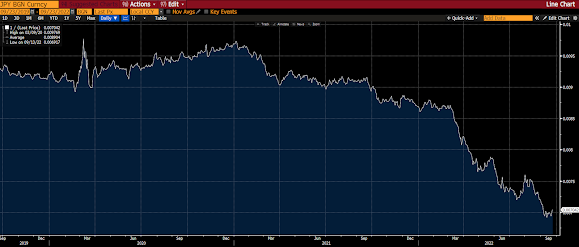
Yeah, the Japanese consumer is none too happy about the state of his/her home currency these past couple of years... And while the Bank of Japan remains stubborn in its ultra-easy monetary policy, it, clearly, is also listening to the citizenry... Macro skeptics will preach that such intervention is doomed to fail without a change of policy to go with it (they're getting their confirmation this morning, btw)... Me, I'll take it for what it is; a concerted attempt at bolstering the yen -- the first of its kind in 24 years...
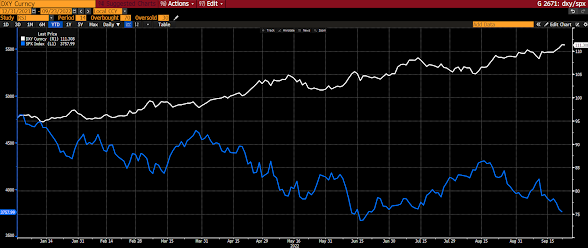
Now, our message this morning is not about the challenges of Japanese central bank policy (although that's a worthy topic for sure), it is, however, about the negative correlation between the US dollar and stocks that characterizes 2022's action thus far.
Have a look (white = USD, blue = SP500):
And here's a look at the USD chart where we do our technical work (I'll also feature this in the next video):
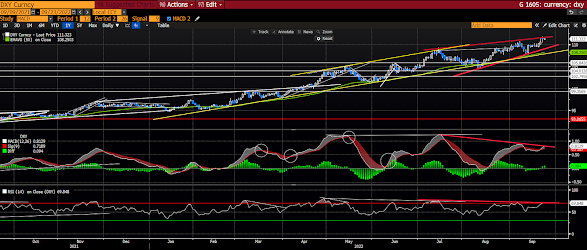
Suffice to say that that's a potentially very bearish technical setup... One that is NOT playing itself out as I type here this morning... The dollar is screaming higher... well, more aptly put, the pound and the Euro are screaming lower... The initial comedown in the dollar, when it occurs, could, frankly, be violent...
I.e., if the dollar breaks through the bottom of that rising wedge pattern over the next few days/weeks, it'll be interesting to see if the present negative correlation to stocks (they'd rally) holds...
Now, make no mistake, while there are other indicators that we can point to to make a case for a decent bear market rally in the very near-term, there's not nearly the lineup of factors like we had earlier this year that allowed us to present a bullish (short-term) case here and there (that played out) with a notable degree of conviction.
In fact, we'd pretty much give equal odds of the SP500 mounting a rally to ~4,000 vs a further decline to, say, 3,650 over the coming days/weeks.
The bullish divergences in the bottom two panels (our momentum oscillators) of the 60-minute chart below support the notion that a nice rally potentially looms (with 4,000 [top green arrow] as a reasonable upside target)... While, if that very distinct bear flag pattern (top panel) were to play out, 3,650 (bottom green arrow) would be our initial downside target:
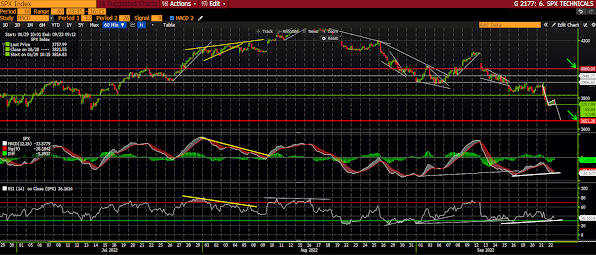
The bear flag pattern is winning out so far this morning...
Per the experts below, present options dealers positioning paints a very similar picture:
"Notwithstanding, with downside protection that’s short-dated charged on this recent move lower, there lies the potential for a sharp move higher, toward $4,000.00 SPX, where Nomura’s Charlie McElligott was recently quoted saying “market makers are ‘long’” a leg of a large JPMorgan collar trade.Stay tuned...
As we stated this AM, too, if markets move to above $4,000.00, then the negative gamma will die off and volatility should reduce, but markets should remain very fluid (i.e. volatility high) under $4,000.00.
Still, a shift lower would worsen the above negative gamma chase. In such a case, $3,600.00 is a key level to watch."
Asian equities followed US's lead overnight, with all but 1 of the 16 markets we track closing lower.
Europe's ugly so far this morning as well, with 18 of the 19 bourses we follow trading down as I type.
US stocks are once again lower to start the session: Dow down 341 points (1.14%), SP500 down 1.29%, SP500 Equal Weight down 1.30%, Nasdaq 100 down 1.08%, Nasdaq Comp down 1.20%, Russell 2000 down 1.51%.
The VIX sits at 28.23, up 3.22%.
Oil futures are up 5.09%, gold's down 1.33%, silver's down 2.96%, copper futures are down 3.44% and the ag complex (DBA) is down 1.67%.
The 10-year treasury is up (yield down) and the dollar is up 0.76%
Among our 35 core positions (excluding options hedges, cash and short-term bond ETF), only 1 (along with our put hedges of course) -- long-term treasuries -- are in the green so far this morning. The losers are being led lower by MP Materials, energy stocks, Brazil equities, base metals miners and uranium miners.
Currency markets are largely fixated (as usual) on interest rate differentials between countries, which has seen the dollar to breathtaking highs, and the yen to crushing lows, this year.
As I continue to express, our longer-term outlook has the dollar trending weaker... The following, from my favorite book on currencies, should be a warning to narrowly-focused currency traders, and speaks to what we see as the longer-term setup:
"Japanese Yen: +99 percent The Japanese yen’s 1999 performance was a resounding attack on conventional theories indicating that rising or high interest rates boosted currencies, while low or falling interest rates were negative for currencies.
In 1999, Japanese short-term rates started the year at a postwar low of 0.25 percent—already the lowest among G7 economies—before being cut to 0.15 percent. Instead, the yen was boosted by a surge of global funds into Japanese stocks with the notion that Japanese markets were set to gain the most from the global recovery story, especially that Japan’s main equity index Nikkei-225 was drifting at 12-year lows in October 1998. The notion of cheap bargain stocks in the world’s second-largest economy during a global boom was the underlying theme to the yen recovery."
"...tumbling Japanese equities reached 12-year lows in September 1998, prompting investors to seek bottom-fishing opportunities in Japanese stocks."
--Laïdi, Ashraf. Currency Trading and Intermarket Analysis: How to Profit from the Shifting Currents in Global Markets
Have a great day!
Marty
Thanks for today's updates. The S&P is getting closer to 3650 this morning. In terms of market perspectives, October CPI index, and upcoming earnings, what is your opinion of everything for the month of October?
ReplyDeleteDifficult to call right here Sam... Rising CPI fully priced in, in my view... Earnings disappointments are beginning to be priced for sure... Between here and there, like I said above, 50/50... Here's the short-term bullish case from a chat with Nick this morning (making no short-term recommendation here):
Delete" (big selloff this month means big rebal into stocks end of month, plus, lots of put buying (dealer hedging) to be unwound, huge net short futures, elevated VIX, weak sentiment, etc. to spark a rally)"
But make no mistake (part of the bearish case), at this moment there's lots of put option activity -- that dealers are hedging -- going on... There's a very big collar managed by JPMorgan where the market is approaching the put strike... The dynamics there will force the dealers on the other side to hedge that exposure by shorting the S&P, potentially adding more pain.. All that shorting, however, will one day have to be covered...